Feb 28, 2010

Weekly review / Седмичен преглед

In the bigger pictures nothing has changed. You can see the charts and the comments from the previous week.

Lets look at the short-term charts - hourly and daily.
As I have expected, we had sideway move this week as the indexes are hitting resistance. DJ lost only -0,74%, DAX was weaker loosing -2,16%.
This sideway move on DJ helped the Histogram to make a tower and carve out a mMm pattern and MACD is at the zero line. Lets wait and see if it will curl over at the zero.
Difficult to trade week up an down... but we had two opportunities to take short position. The sell signal is still in force.
Bearish signs - The Histogram has changed the slope and we have mMm pattern, MACD finds resistance at the zero line, the indexes are hitting resistance - the broken trend line and MA50.

Next week I am leaning toward down move, because we have a lot of resistance.

Some question marks - the candle on Thursday - we can not say yet if this is a hammer the beginning of an up move or a hanging man and to expect down move.
Daily EMAs EMA10,EMA20 and EMA50 have converged together, which means the next bigger move will follow - up or down?

On the hourly charts the trend channel is broken and prices are testing the brake.
BUT we do not have triple cross - the EMAs are moving sideways - prepare for the next bigger move.

So the sell signal is still intact, but the next week the bears must show up, or the next leg down is questionable.


Feb 25, 2010

Short-term trend is now down

We had our bounce and the trend channel on the hourly chart is now broken.
The short-term trend is now down.

Trade - second chance for a short position.

Feb 23, 2010

Short-term trend change

Today we have a short signal:
- mMm Histogram pattern
- candlesticks - close bellow the close of the previous day. Notice at daily chart - two candles with narrow range bodies upper shadows followed by long candle.

The trend channel at hourly chart is still not broken and we do not have triple cross.
That means we can see 1-2 day bounce before the break of the channel.

Close above the high at 10438 will negate the signal.

Trade - open short positions.

Feb 21, 2010

Weekly review / Седмичен преглед

The long-term picture remains bullish. On the weekly chart MACD is above zero and the prices are still above EMA50.

The intermediate-term signals are mixed. The picture is not clear if we will see a-b-c correction or something else.
On weekly chart MACD is bellow its signal line, the prices are bellow MA20, there is double cross for the first time since March.
On daily chart is MACD bellow zero and we have triple cross EMA10 and EMA20 are bellow EMA50 which is bearish.
On the other side - the histogram on weekly chart has made higher bar and MACD have a bullish cross on daily chart.
The prices have bounced of MA200 on daily chart and EMA50 on weekly chart.
In fact the prices are trapped between MA20 and EMA50 on weekly chart and MA50 and MA200 on daily.

The intermediate-term is not clear, so lets leave the bulls and the bears fight for the direction of the market.
Until then I will concentrate on the short-term to see if we can make some profit:)

The short term trend is still UP for the moment.
MACD bullish cross above the signal line, the histogram is rising. The prices are for three days above MA20, but bellow MA50.
On the hourly chart we have a bullish triple cross and MACD is above zero.
BUT short-term I expect another leg down after this rally is over sometimes next week.
On the move down we have had very high volume, we saw distribution and now the rally is on light volume which is declining.
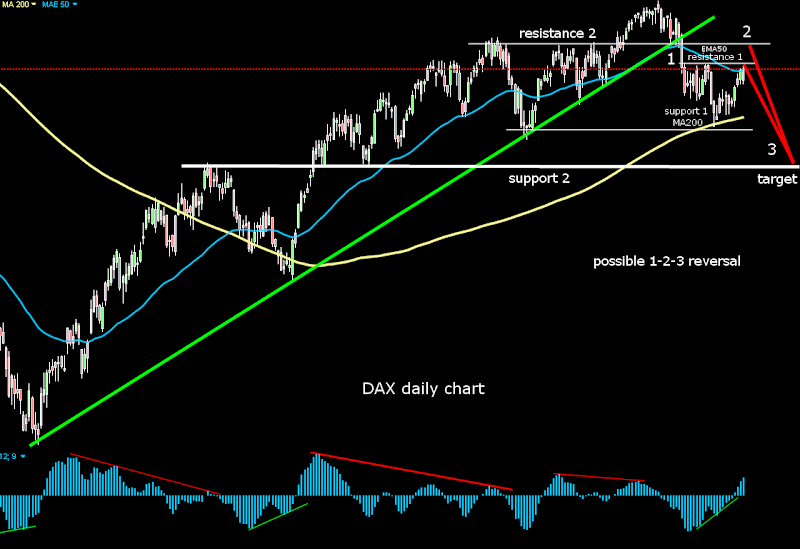
DAX have stopped at resistance EMAs and DJ is testing the broken trend line.
On the hourly chart DJ have a rising wedge and DAX MACD divergence.
We have three wave corrective move hitting 50%(DAX) and 61,8%(SP500) Fibonacci level.
The behavior of the prices and the histogram tells me that this is a corrective move - intuition:).
See the charts bellow.
So if i am right the next week we will see 2-3 days choppy sideway move before the next leg down begin.
The histogram on daily chart and the hourly charts will tell us when the moment has come.
BE DISCIPLINED there is not short signal yet, wait for the histogram to give you a signal and for a candlestick formation. There is always possibility that the markets move higher to resistance 2(see DAX daily) or for a double top for example.

My view - take profits if you are long, and wait for short signal.


I expect 1-2-3 reversal watch next week the prices to turn down at resistance level 1 or 2 and MACD at the zero line.


Feb 18, 2010

Lets start / Да започваме

I am ready with the themes – finally:). I do not claim that they are comprehensive or the best what you can find, but I hope that I have managed to explain, the best way you can use the different tools.
For beginners, which have not yet read some book about technical analysis, the themes could be somehow useless – for those of you look at “Books”. For the others, which already know the indicators and asking themselves - what is the strength of an indicator and how should they combine the different indicators and their signals in different time frames - I think they will find the information useful.
I have uploaded charts showing bull and bear market, so you can compare the behavior of the indicator.
I have posted the trading system, which I use too. I do not know if it will suit you, but for me it is doing perfect job. Its advantage is that it combines the signals of trend-following indicators with oscillators and all this in different time frames. That allows me to spot even short-term moves on daily chart, but staying focused on moves in the direction of the bigger trend.
Again important are the charts and technical analysis. I do not care about news, I do not care about fundamentals, I do not care about the opinion of "gurus". The charts tell us the whole story.

At the beginning I will start posting weekly reviews of the indexes – DAX and DJ and later I will add EUR/USD, Gold and Crude Oil. If I have time I will start post daily comments too.

So I hope the themes and the comments will be useful to you.

---------------------------------------------------------------------------------------------------------------------------------------------------------------------------------------------------------------------------

Темите са готови – най-накрая:) Не претендирам да са изчерпателни или най-доброто което можете да намерите, но се надявам, че съм успял да обясня как да използвате отделните инструменти по най-практичния(печелившия) начин.
За начинаещи, които още не са прочели няколко книжки за технически анализ, темите може да им се сторят безполезни – за тези от вас вижте „Книги”. За другите които вече познават индикаторите и се питат кои са силните им страни или как да комбинират отделните индикатори и техните сигнали в различните времевите интервали, смятам че ще намерят полезни неща.
Качил съм и графики като съм показал бичи и мечи пазар, за да сравните поведението на индикаторите.
Качил съм и системата, която ползвам. Не знам дали ще ви допадне, но на мен ми върши перфектна работа. Преимуществото и е, че комбинира сигналите от тренд следващи индикатори и осцилатори при това на различни времеви интервали. Това ми позволява да открия дори краткосрочни движения на дневна графика, като оставам концентриран върху движения по посока на по-големия тренд.
Да повторя най-важни са графиките и техническия анализ. Не ме интересуват новините, не ме интересува фундамента, не ме интересуват разни "гурута" какво казали. Графиките ни разкват всичко, което трябва да знаем.

Отначало ще започна да публикувам седмичен преглед на индексите – DAX и DJ, а по нататък ще добавя EUR/USD, Gold и Crude Oil. Ако имам време ще започна да публикувам и коментари всеки ден.

И така надявам се темите и коментарите да са ви полезни.