May 30, 2010

Weekly review / Седмичен преглед

Hello, traders!!!
My predictions from the last week have played out perfectly:). We had a sell off which have completed the wave structure and we have started building a base. So I continue to believe that the next move is a rally which will form the right shoulder of a H&S topping pattern.
You can see the charts from the last week. Now we have divergences on the histogram and RSI. NYSE McClellan Oscillator and S&P500 Percent of Stocks above 50 day moving average hit extremes and tell us to expect move in the opposite direction.
But this rally will make lower highs and it will be part of a topping process. Why? -Because of the MACD divergences on the weekly charts.


May 26, 2010

Wave structure looks complete

Hello,
now the wave structure looks complete. I expect some base followed by a bounce to develop.
Look at the chart bellow it has played out very nice:))

May 23, 2010

Weekly review / Седмичен преглед

Hello traders!!!
As I have expected a sell of and thats what happened. The indexes finished the week on the red - DJ -426 points(-4%) and DAX -227 points(-3,76%).
I was surprised from the speed... again:)) I was expecting the Dow to hit support the February lows but no so fast:)

So whats next?
The long-term charts are not changed Weekly oscillators and MACD are pointing down, Market breadth indicators - Bullish percentage and NYSE McClellan Summation index are bearish and pointing down.

So I will show the short-term and intermediate-term charts - hourly and daily.

Short-term - Dow has hit support but looking at the hourly charts the wave structure does not look completed so I expect short move up wave 4 followed by another move down the last 5-th wave.(This is DAX but Dow looks the same way)

Intermediate-term - I think we will find support around the February lows ~9800-9900.
Look at the NYSE McClellan Oscillator and S&P500 Percent of Stocks above 50 day moving average - they are at extremes and tell us to expect move in the opposite direction. So next week or two I expect to build some base followed by a rally. But i do not expect this rally to make new highs rather a right shoulders ~10750 of a large H&S topping pattern.


I have shown the move with higher probability for me, but we have only one bullish candle from Friday no single other bullish signal so the indexes could just go lower and stay oversold for some time. Than we will see something like the charts bellow.


May 16, 2010

Weekly review / Седмичен преглед

Hello traders,
huge swings ha?
Many are surprised from the moves, but on 28 April I wrote that correction has began. Surprised could be some one which does not watch the charts and does not listen what the market says.
I must admit that I have not expected such huge swings.... but when you are on the right side of the trade who cares:)
The market is very volatile, trying to forecast what will happen in two weeks or two months is very very difficult as long the trend is not clear. So what opportunities do we have?
- day trading use 1h and 15min charts and go with the flow until we have clear trend
- stick to the facts:) look at the charts and find the highest probability

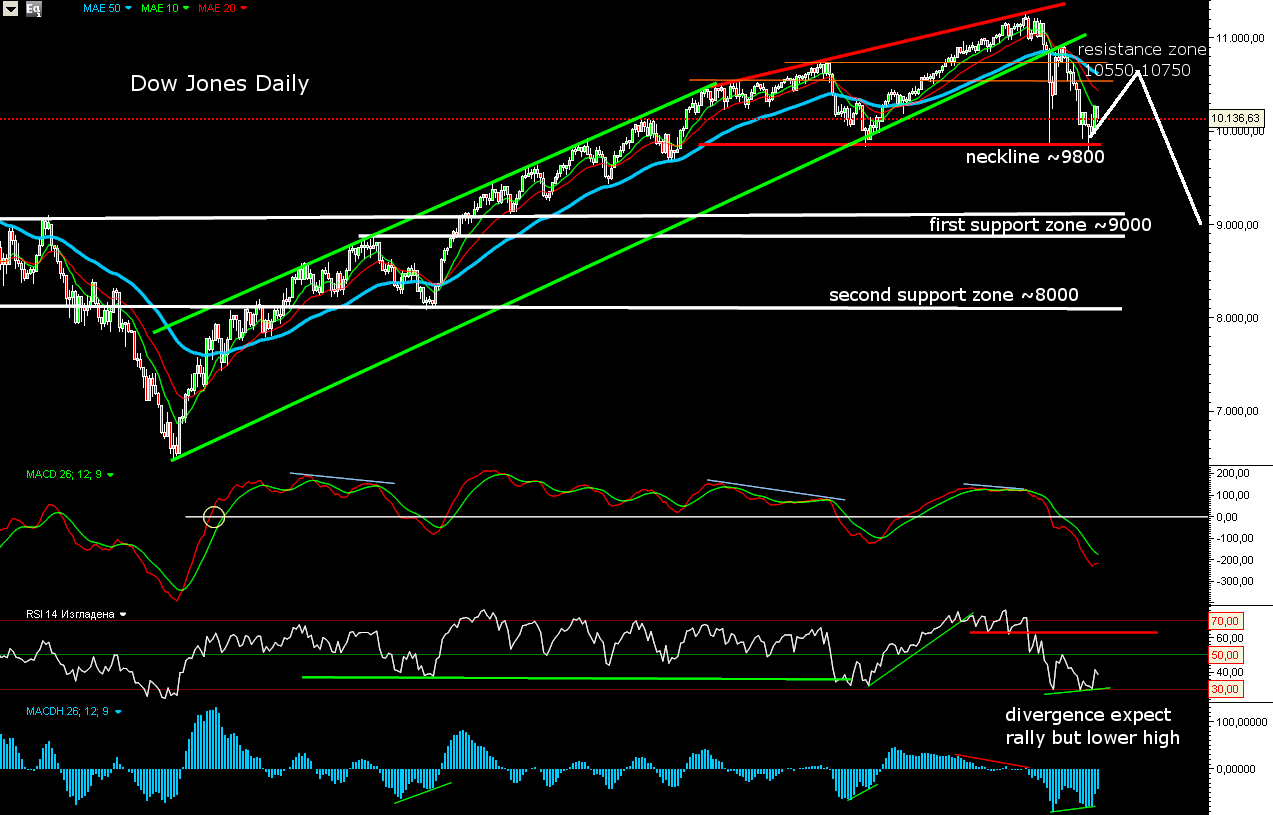
So I will show the charts and see how the probabilities look like.
For me the highest probability looking at the charts is that the move from March 2009 is over and in the next months the indexes will carve out some kind of topping pattern. WHY?
- look at the market breadth indicators (see the post from 28 April). They are telling us that the party is over. They have shown us the 2009 bottom and now screaming TOP
- MACD and the oscillators on the weekly charts are pointing down
- divergences on the weekly charts MACD
- resistance zone hit and Fibonacci retracement
- broken trend lines

Where is the catch? The problem is that on the weekly charts MACD is above the zero line, the prices are above EMA50 and we do not have lower low. That means a down trend is not confirmed that is why I expect in the next months a top to develop. The last chart shows bullish scenario keep it in mind. Even if it plays out and we hit new highs in the next 2-3 months this will be part of some kind of top.


Looking at the charts above the most probable scenario is the bearish one - something like that:

On the weekly charts the prices are still above EMA50 and MACD above the zero line. So we must keep in mind an alternative bullish scenario if the bearish one does not play out.

May 15, 2010

Back to work

Hello,
back in Austria:)

Crazy moves this two weeks - ha ha:)
But I have warned you, the party is over....

Tomorrow I will post several charts.