Dec 18, 2010

Weekly review / Седмичен преглед

Hello traders!!!
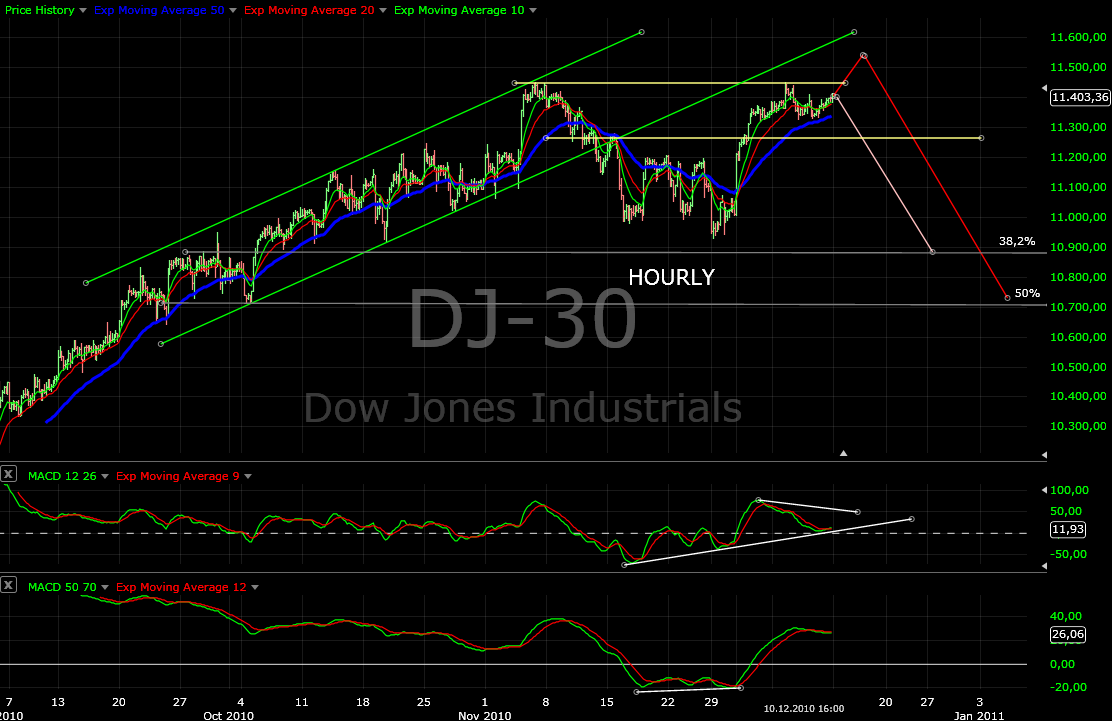
I expected a little bit higher prices this week and that is what happened. DJIA is 81 points higher for the week. Next week I expect the same action. Look at the first chart - it looks like we have a triangle or a pennant and the price bounces from support and EMA50. MACD is turning UP again at the zero line. Seasonally are the last two week positive too.
But be careful the indicators and the market breadth indicators are bearish. Pay close attention on Monday if DJ open higher or lower than the close on Friday.

The big picture has not changed. I expect a correction but with such extremes at the market breadth indicators and the sentiment I think that now there is high probability for a deeper correction. The two scenarios are shown bellow. The last two charts show how this scenarios look like on the daily chart.
- If we have a deep correction that means, that the market is no so strong as i thought and the next move UP can end up at the first resistance around 11750.
- If the market work out the overbought conditions and stays above ~11000(the November lows) this will be a signs of a strength and the move could reach the next resistance ~12750.
With the divergence on daily chart MACD and RSI,the market breadth indicators and the extreme bullish sentiment, I am leaning more toward the first scenario - a deeper correction, but lets wait and see what the market will tell us.

More shallow correction

Deeper correction

SP500 percent of stocks above MA50
The first divergence warned us about the november correction. Now we have much bigger divergence. That is way I expect a bigger and longer correction.

Dec 11, 2010

Weekly review / Седмичен преглед

Hello traders!!
This week nothing happened... SPX500 made new highs, but DJIA not. I think the alternate scenario, which I have shown last week, will play out.
We are at an intermediate top, and we will see a correction at least 3 to 4 weeks.
Why? Look at the last two charts
- TRIN shows that the market is extremely overbought
- Put to Call Ratio shows that the traders are extremely bullish.
- Bullish percentage at 83%
- McClellan Summation index moving down
That are not indicators pointing to imminent rally. All this indicators are telling us that the risk is very high now. Every trader with common sense should not trade high risk, is not it?

Look at the hourly chart MACD is at the zero line but turning up. A little bit higher prices for a day or two are possible, but that is all.
Even if we see a rise next week, we will have MACD/RSI divergence on the daily chart.(the second chart)
So I think in the next weeks we will see something like that shown on the charts bellow:


Dec 4, 2010

Weekly review / Седмичен преглед

Hello traders!
This week we saw strong rally and as the bigger picture is bullish we should assume that the next leg UP has began.
The first two charts show how it could look short term and long term.


Yes, we should follow the market and see what happens. But be cautious, something feels wrong. The correction does not look right. It is too short in time. Some of the indicators are still in overbought state...
I have the suspicion that something like the shown on the two charts bellow could happen.
If we make new high but not convincing with long bar and high volume, expect the scenario bellow.