Jul 31, 2014
Update
The bulls are feeling the pain today..... DJ now exactly 0% gain for the year. How bullish is this? I wrote already that it is just an illusion.
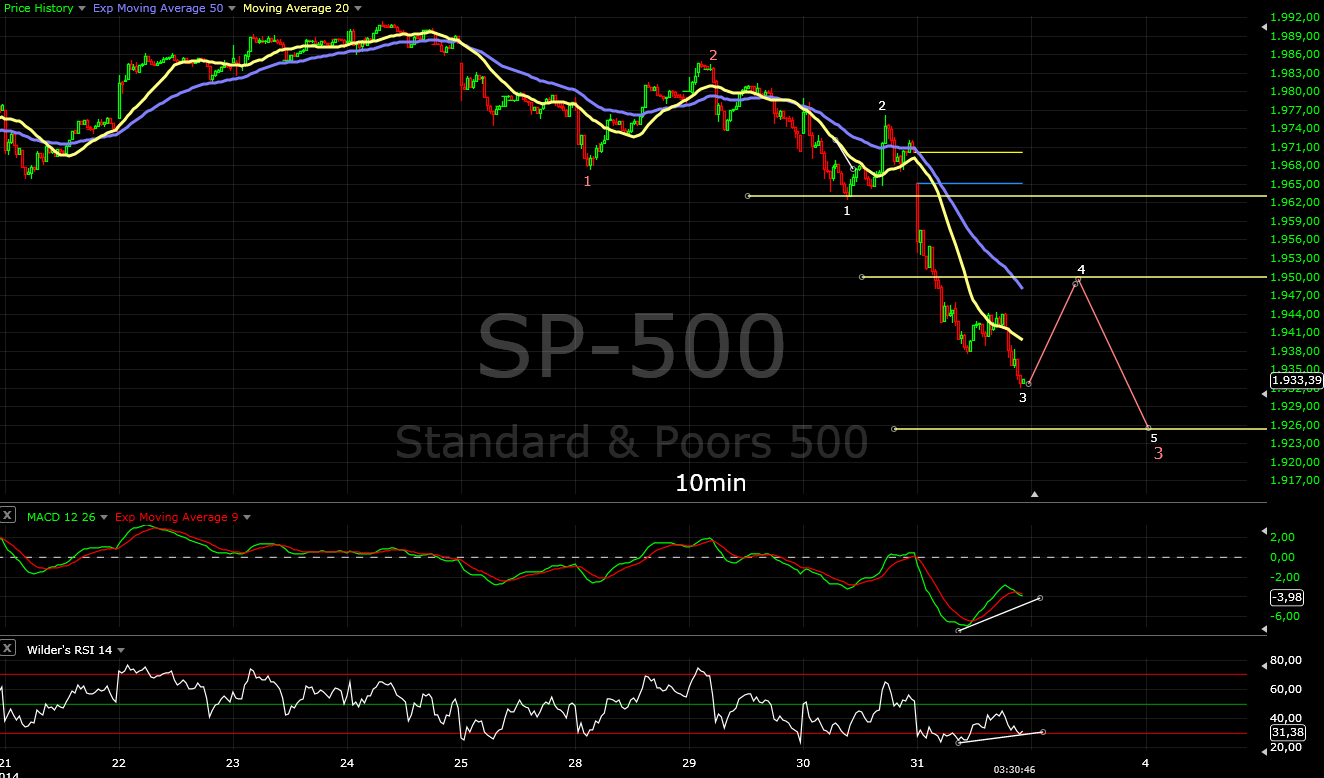
SP500 has not found support at 1950 and now this wave is much longer than the first impulse, the price plunged bellow MA50....
I do not see another way to count this move - it is an impulse with extended wave 3. Wave 1(red)=24 points extended wave 3(red)=1x2,1618=63 or target around 1922. We should see 4(white) to 1950 resistance/38,2% Fibo and another wave lower 5(white) with the same size like 1(white) - target is 1927.
Short said watch 1925 support and 38,2% Fibo from the high for the end of 3 red and probably 1900 for wave 5 from the high before meaningful rebound.
The problem is if we see such an impulse lower the move could be something more than a pullback... it could be deeper and last longer than I have expected. Targets 1925 and 1900 does not surprise me at all they are on my list for a long time but the speed and the impulsive move are raising question marks.

Update
The CFD gives much better picture all the mess from the last days was B (a b c all corrective waves) and now we are in 3 of C. Watch the area around 1950 for possible bottom.


Jul 30, 2014
Update
The pattern is even uglier and choppier than expected.... I hate news and FOMC. They do not change the trend but distort the pattern.
We have impulse lower, corrective structure up, another move which made lower low but instead strong wave 3 or C it looks like another corrective shit. My guess is running flat..... a move does not finish with a corrective structure so the main idea stays the same we should see one more impulse lower to finish this move.
Someone with better ideas? I am just an EW amateur:)


Jul 29, 2014
Update
When I wrote we will adjust the short term forecast on daily basis I did not mean three times a day, but the market is in a hurry this two days...
So here is more chart porn..... what should I do "Algos gone wild":))))))
The market bottomed at 1973 than it made a top at 1981 as the chart from the previous post shows. Now the problem is I am not sure what would happen. It depends on how the market will interpret the news tomorrow.
The markets closed as if we have a-b-c with a=c the DJ shows better picture you can see waves a and c are clear 5 wave patterns with the same size (red scenario W-X-Y). On the other side why not the white scenario very simple pattern impulse lower correction and another impulse lower if the market does not like the numbers.
In hindsight it will be easy to say hey it was obvious, but with GDP and FOMC tomorrow I can not tell you what the algos will do.
I have the feeling that we will see W-X-Y because it will screw more traders up, both bears and bulls.... and that is what the market usually does.


Update
I took my money of the table.
DAX finished perfect a-b-c, SP500 CFDs hit the target for X 1973 nice entry (not so much for some one who trades the cash index) there is high probability Y has finished at 1985.
Update - Wow that was very fast again the drop... I can not finish my post.
Update: This is what I see at the moment... after FOMC we should see lower high...


Jul 28, 2014
Update
Wow that was fast, it was more like 3 hours and not 2 days:)
We have two legs higher of the same size and I think this is a-b-c zigzag but the move does not look finished so I still think FOMC should be a top and I expect dip to support/Fibo and higher again.
The alternate scenario is we have 5 waves down 3 up and another impulse lower has started... than FOMC and FED saves the day on Wednesday(watch 1973 support).
It is crazy how support/resistance and Fibo levels match perfectly - see the chart from the previous post and this one:)


Update
This is what I see at the moment.... one more push lower as expected and I think reversal has started. As long as the price stays above 1965 everything is OK... I can not imagine that the indexes will plunge before FOMC on Wednesday but we should draw the line where we are wrong:)
You can see on the chart the trend lines, resistance, Fibo levels... we will see what happens in the next two days.


Jul 27, 2014
Weekly review
Short term view - choppy down up down, a lot of news FOMC GDP NFP....
Intermediate term view - pullback for 2 weeks.
I was expecting one more high for 3-5 days to finish intermediate wave 3 and that is what happened no surprises. Now I am curious if my next forecast for a pullback wave 4 will be right:)
My forecast is for a pullback wave 4 targets 1925 or 1900(see second chart).
Last week I wrote why we should see a top using different approaches EW/Cycles etc. Now I will try to explain why the move lower should be only a pullback:
+ Cycles - we saw another right translated 40 day cycle with top late in the cycle which hints that we should see another higher high.
+ EW - when I watch the SP500 and DAX chart I see missing wave 4 and 5 intermediate term.
+ Market breadth - tells me we are in a correction for a while... McClellan Oscillator and Weekly Stochastic of the Summation Index for example hit already oversold levels. That is not the way usually the corrections start. Such behavior is common for corrective moves against the trend.
+ The price is above MA50 and MA200 - it will be very rare to see the price just plunging trough the moving averages. This could happen if we saw some kind of exhaustion huge bars up... but the indexes are just crawling higher for the last several months and topping process has higher probability.
- Weekly chart - huge divergences MACD divergences which could lead to a sharp correction 10% or more
I see only one reason for something bigger than a pullback... even if this is the case, the mistake will be in our favor so I do not worry about that:) We will just watch the price action and decide if we should adjust the forecast.
I think that something to the downside has begun because the price action looks like an impulse, the candle formation looks bearish, double MACD divergence, we are late in the 40 day cycle. I am wrong if on Monday the price gap higher and move above resistance 1982(first chart).
Next week should be choppy - we have a lot of news FOMC / GDP / NFP, the first impulse lower should finish on Monday, correction mutate very often, the corrective moves begin weak and choppy next week we should see wave A and B.... so I do not think I can give a good forecast for the short term, rather we should adjust it on daily basis.
TECHNICAL PICTURE
Short term - my best guess is one more push to finish an impulse than a retracement for the beginning of the week.

Intermediate term - MACD broken trend line and double divergence - something to the downside has begun. Two support areas are visible 1925 support/trend line/38,2% Fibo and 1900 support/the lower trend line/50% Fibo.
The surprise will be if we see only 23,6% Fibo retracement to around 1950 and MA50... but it is possible.
Long term - I do not think that any move higher will clear the MACD divergence and start another long lasting rally. I think the next big move will be lower, but it could last months until we reach this point. Do not fall asleep, double MACD divergence on the weekly chart means expect something nasty...

MARKET BREADTH INDICATORS
The Market Breadth Indicators - are telling for a while that we are in a correction and I think the price will follow in the next days. But such behavior is common for corrective move against the trend.
McClellan Oscillator - bellow zero for a long time, correction is running.
McClellan Summation Index - sell signal
Weekly Stochastic of the Summation Index - sell signal and already in oversold territory.
Bullish Percentage - sell signal.
Percent of Stocks above MA50 - in the middle of the range, correction is running.
Fear Indicator VIX - making higher lows and warning us for a reversal.
Advance-Decline Issues - this time the cumulative chart - for the first time for a long time we see a divergence... come on bears:)
HURST CYCLES
Day 30 the cycle it is time to see the downward phase of the 40 day cycle. SP500 toped even later in right translated cycle so I expect another higher high after the pullback.
No change - waiting a few more weeks and the top of the 40 week cycle.
Intermediate term view - pullback for 2 weeks.
I was expecting one more high for 3-5 days to finish intermediate wave 3 and that is what happened no surprises. Now I am curious if my next forecast for a pullback wave 4 will be right:)
My forecast is for a pullback wave 4 targets 1925 or 1900(see second chart).
Last week I wrote why we should see a top using different approaches EW/Cycles etc. Now I will try to explain why the move lower should be only a pullback:
+ Cycles - we saw another right translated 40 day cycle with top late in the cycle which hints that we should see another higher high.
+ EW - when I watch the SP500 and DAX chart I see missing wave 4 and 5 intermediate term.
+ Market breadth - tells me we are in a correction for a while... McClellan Oscillator and Weekly Stochastic of the Summation Index for example hit already oversold levels. That is not the way usually the corrections start. Such behavior is common for corrective moves against the trend.
+ The price is above MA50 and MA200 - it will be very rare to see the price just plunging trough the moving averages. This could happen if we saw some kind of exhaustion huge bars up... but the indexes are just crawling higher for the last several months and topping process has higher probability.
- Weekly chart - huge divergences MACD divergences which could lead to a sharp correction 10% or more
I see only one reason for something bigger than a pullback... even if this is the case, the mistake will be in our favor so I do not worry about that:) We will just watch the price action and decide if we should adjust the forecast.
I think that something to the downside has begun because the price action looks like an impulse, the candle formation looks bearish, double MACD divergence, we are late in the 40 day cycle. I am wrong if on Monday the price gap higher and move above resistance 1982(first chart).
Next week should be choppy - we have a lot of news FOMC / GDP / NFP, the first impulse lower should finish on Monday, correction mutate very often, the corrective moves begin weak and choppy next week we should see wave A and B.... so I do not think I can give a good forecast for the short term, rather we should adjust it on daily basis.
TECHNICAL PICTURE
Short term - my best guess is one more push to finish an impulse than a retracement for the beginning of the week.

Intermediate term - MACD broken trend line and double divergence - something to the downside has begun. Two support areas are visible 1925 support/trend line/38,2% Fibo and 1900 support/the lower trend line/50% Fibo.
The surprise will be if we see only 23,6% Fibo retracement to around 1950 and MA50... but it is possible.

Long term - I do not think that any move higher will clear the MACD divergence and start another long lasting rally. I think the next big move will be lower, but it could last months until we reach this point. Do not fall asleep, double MACD divergence on the weekly chart means expect something nasty...

MARKET BREADTH INDICATORS
The Market Breadth Indicators - are telling for a while that we are in a correction and I think the price will follow in the next days. But such behavior is common for corrective move against the trend.
McClellan Oscillator - bellow zero for a long time, correction is running.
McClellan Summation Index - sell signal
Weekly Stochastic of the Summation Index - sell signal and already in oversold territory.
Bullish Percentage - sell signal.
Percent of Stocks above MA50 - in the middle of the range, correction is running.
Fear Indicator VIX - making higher lows and warning us for a reversal.
Advance-Decline Issues - this time the cumulative chart - for the first time for a long time we see a divergence... come on bears:)
HURST CYCLES
Day 30 the cycle it is time to see the downward phase of the 40 day cycle. SP500 toped even later in right translated cycle so I expect another higher high after the pullback.

No change - waiting a few more weeks and the top of the 40 week cycle.

Jul 24, 2014
Update
It think we are in the late stages of this move.
There is probably 5-10 points higher left, but with wave 3 already(or soon) behind us there is no more easy money:) I will be very surprised if the indexes suddenly accelerate...


Update
Dip lower, break out and new ATH, everything according to the plan.... sounds great but the move is weak and DJ does not follow so be cautious.
It looks like small waves 4 and 5 of this final wave 5 are missing. Projection for wave 5 using wave 1 is 2000. We will see in the next days if SP500 will hit the big round number:)
If the price move inside the triangle again will be a bad sign. Bellow 1975 probably wave 5 is over. Bellow 1965 is definitely something wrong and confirmation that a move to the downside has begun.


Jul 19, 2014
Weekly review
Short term view - wave 5 up.
Intermediate term view - when it is over a pullback for 2 weeks probably.
Veeeeery choppy week it could be only a triangle this mess. A triangle is usually wave 4 and with 20 points rally I think wave 5 has begun.
I do not think that this wave will last for a long time.... probably it will end suddenly with intraday reversal so be prepared.
All different methods I use are starting to align showing the same, so I am pretty confident that after this high a pullback will start (see the second chart).
- EW - triangle which is usually wave 4, wave 5 up and a correction should follow.
- Market breadth moved lower substantially and divergence should follow after a new high... and the long term indicators are showing sell signal already.
- Cycles - day 25 near to a top of the 40 day cycle. Another 3-4-5 days up for a top and 10 days pullback for a nice 40 day cycle.
- TomDemark countdown finished - the previous two occasions have led to a pullback (see the last chart).
Not that I want to spoil the bull party, but we should be prepared. Short said enjoy the move higher, but do not fall in love with it:)
TECHNICAL PICTURE
Short term - probably small dip from resistance and continuing higher with 3 of 5.

Intermediate term - after a new ATH I expect a pullback. I see two targets 1925 support/first trend line/MA50/Fibo 38,2 and 1900 support/second trend line/Fibo 50%.

Long term - I do not think that any move higher will clear the MACD divergence and start another long lasting rally. I think the next big move will be lower, but it could last months until we reach this point. Do not fall asleep, double MACD divergence on the weekly chart means expect something nasty...

MARKET BREADTH INDICATORS
The Market Breadth Indicators - moved lower substantially(not usual for a wave 4... a top around the corner?) and divergence should follow after a new high... and the long term indicators are showing sell signal already.
McClellan Oscillator - reached very low levels which often mark a low and now rising.
McClellan Summation Index - sell signal.
Weekly Stochastic of the Summation Index - sell signal.
Bullish Percentage - sell signal.
Percent of Stocks above MA50 - probably it will move above 75 but with divergence.
Fear Indicator VIX - expect higher low and divergence.
Advance-Decline Issues - made lower low... the market is not very healthy. The market is making new ATH and the indicator is headed south.
HURST CYCLES
Day 25 we are near to the top of the current 40 day cycle.
No change - waiting a few more weeks and the top of the 40 week cycle.
Tom Demark SEQUENTIAL AND COUNTDOWN - this technique spots areas of exhaustion.
Countdown has been finished... not a surprise. The previous two occasions have led to a pullback... wait for a price flip to trigger it.
Intermediate term view - when it is over a pullback for 2 weeks probably.
Veeeeery choppy week it could be only a triangle this mess. A triangle is usually wave 4 and with 20 points rally I think wave 5 has begun.
I do not think that this wave will last for a long time.... probably it will end suddenly with intraday reversal so be prepared.
All different methods I use are starting to align showing the same, so I am pretty confident that after this high a pullback will start (see the second chart).
- EW - triangle which is usually wave 4, wave 5 up and a correction should follow.
- Market breadth moved lower substantially and divergence should follow after a new high... and the long term indicators are showing sell signal already.
- Cycles - day 25 near to a top of the 40 day cycle. Another 3-4-5 days up for a top and 10 days pullback for a nice 40 day cycle.
- TomDemark countdown finished - the previous two occasions have led to a pullback (see the last chart).
Not that I want to spoil the bull party, but we should be prepared. Short said enjoy the move higher, but do not fall in love with it:)
TECHNICAL PICTURE
Short term - probably small dip from resistance and continuing higher with 3 of 5.

Intermediate term - after a new ATH I expect a pullback. I see two targets 1925 support/first trend line/MA50/Fibo 38,2 and 1900 support/second trend line/Fibo 50%.

Long term - I do not think that any move higher will clear the MACD divergence and start another long lasting rally. I think the next big move will be lower, but it could last months until we reach this point. Do not fall asleep, double MACD divergence on the weekly chart means expect something nasty...

MARKET BREADTH INDICATORS
The Market Breadth Indicators - moved lower substantially(not usual for a wave 4... a top around the corner?) and divergence should follow after a new high... and the long term indicators are showing sell signal already.
McClellan Oscillator - reached very low levels which often mark a low and now rising.
McClellan Summation Index - sell signal.
Weekly Stochastic of the Summation Index - sell signal.
Bullish Percentage - sell signal.
Percent of Stocks above MA50 - probably it will move above 75 but with divergence.
Fear Indicator VIX - expect higher low and divergence.
Advance-Decline Issues - made lower low... the market is not very healthy. The market is making new ATH and the indicator is headed south.
HURST CYCLES
Day 25 we are near to the top of the current 40 day cycle.

No change - waiting a few more weeks and the top of the 40 week cycle.

Tom Demark SEQUENTIAL AND COUNTDOWN - this technique spots areas of exhaustion.
Countdown has been finished... not a surprise. The previous two occasions have led to a pullback... wait for a price flip to trigger it.

Jul 17, 2014
Update
The triangle is still possible... but I am sceptical:) DJ made its higher high Russell2000 and Europe are looking bad. Last chance to reverse is 1960 where c=a for E of the triangle or we will have failed wave 5 and a double top.
 If SP500 moves bellow 1960 we can see a double top. I do not think that the risk is worth to chase longs...


Update
It is getting time... after a choppy corrective mess we should see finally break out and some strength negating the RSI/MACD divergences.
Alternate the mess is not over and E of the triangle should follow to finish it around 1960.


Jul 14, 2014
Update
The price action looks more bullish than bearish...
New lower low has now low probability so I have changed the alternate scenario (the "bearish" one in red) - possible triangle suggested by kkandru.
We will know tomorrow - dip to support for the more bullish scenario(white) or wave E of a triangle to 1960-1965.


Jul 12, 2014
Weekly review
Short term view - strong green Monday... if I am right.
Intermediate term view - another ATH... if I am right.
There is high probability that we saw running flat and the next wave 5 higher has begun. I have called the top of wave 3(first chart) and then I was wrong that we should see a pullback. A running flat will explain this - technically we saw wave 4, but with higher prices in the same time.
Now if I am right wave 5 has begun with target minimum 2000. If this is the case we should see a strong move up on Monday. Look at the daily chart and the last three bars - the price is trying to turn up so SP500 should rally on Monday or something else is going on.
The week should be green too... and not just a little bit, the price should be near the previous high. The weekly chart is not so bullish and another red week would be a confirmation for something bigger to the downside.
TECHNICAL PICTURE
Short term - this is what expect for now....

This is if something goes wrong - the red scenario. The preferred scenario (white) we are in wave 5 and some kind of wave 3 should begin on Monday... brief pause at resistance and higher.
The red scenario we are in a double zigzag. Wave W has finished and we are now in X. Than Monday should be up but weak reaching resistance and 61,8% retracement and another wave lower to around 1940 begins.
Intermediate term - the chart adjusted. One final high before a pullback. The last three days argue that the price is trying to turn up - green day, hammer and another small green day with a shadow... but this must be confirmed on Monday.

Long term - I do not think that any move higher will clear the MACD divergence and start another long lasting rally. I think the next big move will be lower, but it could last months until we reach this point. Do not fall asleep, double MACD divergence on the weekly chart means expect something nasty...

MARKET BREADTH INDICATORS
The Market Breadth Indicators - ummmmm mixed signals. The message is we are near to a top, but I can not say if we saw it already.
McClellan Oscillator - plunged bellow the BB and bounce was expected. We will see if it is something more.
McClellan Summation Index - sell signal with double top.
Weekly Stochastic of the Summation Index - sell signal.
Bullish Percentage - not really impressed, still on buy.
Percent of Stocks above MA50 - moved lower to 75, but still no sign for a strong move lower.
Fear Indicator VIX - jumped higher from very low levels.... probably it will cool off next week.
Advance-Decline Issues - continue moving in a range... now lower low to confirm something to the downside has begun.
HURST CYCLES
I think we saw 20 day cycle low and the next one should bring another high and the top for the 40 day cycle... and a pullback will mark the 40 day cycle low.
No change - waiting a few more weeks and the top of the 40 week cycle.
Tom Demark SEQUENTIAL AND COUNTDOWN - this technique spots areas of exhaustion.
The daily and weekly chart are not so interesting that is way I thought I will post the monthly chart.
First from technical point of view you are seeing the wedge... I wrote already that the wedges are on all time frames. The boundaries are very tight and the price should break soon up or down. Do you think it will be up:)
Combo has finished and we are at 11 of a countdown at the moment. If this month closes above 1924 we will have 12 and any new high in August will be a 13... now when I think about it, it fits perfect with cycles and a top in early August... interesting.
The previous time we saw TD Sequential on the monthly chart was in 2011 and we saw serious correction. I bet this time we will see 10%+ correction too.
Intermediate term view - another ATH... if I am right.
There is high probability that we saw running flat and the next wave 5 higher has begun. I have called the top of wave 3(first chart) and then I was wrong that we should see a pullback. A running flat will explain this - technically we saw wave 4, but with higher prices in the same time.
Now if I am right wave 5 has begun with target minimum 2000. If this is the case we should see a strong move up on Monday. Look at the daily chart and the last three bars - the price is trying to turn up so SP500 should rally on Monday or something else is going on.
The week should be green too... and not just a little bit, the price should be near the previous high. The weekly chart is not so bullish and another red week would be a confirmation for something bigger to the downside.
TECHNICAL PICTURE
Short term - this is what expect for now....

This is if something goes wrong - the red scenario. The preferred scenario (white) we are in wave 5 and some kind of wave 3 should begin on Monday... brief pause at resistance and higher.
The red scenario we are in a double zigzag. Wave W has finished and we are now in X. Than Monday should be up but weak reaching resistance and 61,8% retracement and another wave lower to around 1940 begins.

Intermediate term - the chart adjusted. One final high before a pullback. The last three days argue that the price is trying to turn up - green day, hammer and another small green day with a shadow... but this must be confirmed on Monday.

Long term - I do not think that any move higher will clear the MACD divergence and start another long lasting rally. I think the next big move will be lower, but it could last months until we reach this point. Do not fall asleep, double MACD divergence on the weekly chart means expect something nasty...

MARKET BREADTH INDICATORS
The Market Breadth Indicators - ummmmm mixed signals. The message is we are near to a top, but I can not say if we saw it already.
McClellan Oscillator - plunged bellow the BB and bounce was expected. We will see if it is something more.
McClellan Summation Index - sell signal with double top.
Weekly Stochastic of the Summation Index - sell signal.
Bullish Percentage - not really impressed, still on buy.
Percent of Stocks above MA50 - moved lower to 75, but still no sign for a strong move lower.
Fear Indicator VIX - jumped higher from very low levels.... probably it will cool off next week.
Advance-Decline Issues - continue moving in a range... now lower low to confirm something to the downside has begun.
HURST CYCLES
I think we saw 20 day cycle low and the next one should bring another high and the top for the 40 day cycle... and a pullback will mark the 40 day cycle low.

No change - waiting a few more weeks and the top of the 40 week cycle.

Tom Demark SEQUENTIAL AND COUNTDOWN - this technique spots areas of exhaustion.
The daily and weekly chart are not so interesting that is way I thought I will post the monthly chart.
First from technical point of view you are seeing the wedge... I wrote already that the wedges are on all time frames. The boundaries are very tight and the price should break soon up or down. Do you think it will be up:)
Combo has finished and we are at 11 of a countdown at the moment. If this month closes above 1924 we will have 12 and any new high in August will be a 13... now when I think about it, it fits perfect with cycles and a top in early August... interesting.
The previous time we saw TD Sequential on the monthly chart was in 2011 and we saw serious correction. I bet this time we will see 10%+ correction too.

Jul 11, 2014
The two faces of the market
Two charts short term optimistic, but intermediate term and probably long term it does not look good.
I think the charts show the two faces of the market - it makes higher lows and higher highs no real corrections the dips are been bought creating an illusion for a strong market, but the second chart is telling a story for a weak and tired market.
P.S. I could be wrong for the last final wave so it is really time to prepare if the markets turn lower. Now or in two weeks... it is better to prepare now as to be surprised.
Short term if I am right we saw rare running flat and wave 5 begun.... target the so much expected 2000. Yeaaaaah the next dip to buy... not so fast look the next chart.
 Look at now the longer term and DJ... that is not a strong market it is ~330 points or 2% higher for the year. No more strong rallys just crawling higher and the corrections are missing creating the illusion for a strong bull market. This is not a strong market this is a weak and tired market.
If the price moves bellow the wedge trend line, support and MA50 it is game over.
Look at now the longer term and DJ... that is not a strong market it is ~330 points or 2% higher for the year. No more strong rallys just crawling higher and the corrections are missing creating the illusion for a strong bull market. This is not a strong market this is a weak and tired market.
If the price moves bellow the wedge trend line, support and MA50 it is game over.


Jul 10, 2014
Update
Bounce as expected... No impulse lower the bears have failed again. This should not be an important top, so I am not surprised. The bounce looks choppy and corrective... probably A-B-C with target 1950. If this is the case SP500 should open lower below 1970.


Jul 9, 2014
Update
The European index look ugly CAC40 has 5 wave lower, DAX30 this is definitely not a dip. I think they have started a move lower of a bigger degree. I expect soon a bounce higher there.
The US indexes - lower as expected but much deeper and two minor support levels have been broken. A bounce expected soon too. But be careful if you see another low low we will have an impulse(the white scenario) in this case expect lower high. For the yellow scenario the index should start moving higher and not look back leaving the bears with corrective move lower.


Jul 6, 2014
Weekly review
Short term view - a dip which is a buy opportunity and final wave before a pullback.
Intermediate term view - pullback and final move higher before more significant correction.
Well I was wrong!!! I was expecting ending diagonal wave 4 and 20 week cycle low before another move higher.... all we have got was small wave 4 of a lower degree. The pattern which I was tracking has changed but not dramatically, the main idea stays the same.
What I think we will see is a dip and another high, followed by a pullback 3%-4%, another high and than more significant correction. The next 3-4 weeks should be ok for the bulls but after that in August we should be very cautious. I see wedges and waves 4 and 5 on all time frames... it is scary a little bit:) a correction lower should be very sharp.
Why the prediction above:
- Elliot waves - what I see is wave 4 and 5(the first chart) to finish wave 3 and than we should see 4 and 5 of a bigger degree(the second chart) to finish 3(or 5) of even bigger degree. Final waves higher on all time frames....
- Cycles - the low for last 20 week cycle was barely visible which means for me the bigger cycle the 40 week cycle is the dominant. It has average size 30-35 weeks with 4-5 weeks the phase to the downside. Currently it is 22 weeks old which means min 4-5 weeks and max 7-8 weeks higher. Another 4-5 weeks higher will fit with the EW analysis before significant correction and we will enter the period which is statistically the weakest - mid August-September to the end of October.
- Market breadth - short term I see weakness. SP500 moved 25 points higher and McClellan Oscillator 7,50 points lower and it is barely above zero - big red flag for the short term. Intermediate term some divergences were erased. My interpretation is that we should see a pullback and another high with divergences before a significant top. The same message repeats....
- Indicators - the price is still above MA50 on daily and weekly - the trend is still up. We see higher lows and higher highs - the up trend is intact.
We see MACD divergences on the daily and weekly chart. Weekly - it can last for a while before it kicks in so there is no problem to see a correction later and we should look for signs on the daily chart. The Daily chart - the MACD peaks are not far from each other. Most of the time such divergences are warnings for a top but not a significant top. In EW terms such divergence usually appear when wave 3 is finishing(expect 4 and 5). It is a warning sign but such a low tests MA50 and usually is been bought. After that if you see a lower high or higher high with even bigger divergence - this is the high which you should sell. Short said the same message like above....
That is what I see. I hope the information is helpful:)
TECHNICAL PICTURE
Short term - MACD divergence.... good for a 10 points dip.

Intermediate term - still waiting for a pullback to MA50... or wave 4 in EW terms.

Long term - I do not think that any move higher will clear the MACD divergence and start another long lasting rally. I think the next big move will be lower, but it could last months until we reach this point. Do not fall asleep, double MACD divergence on the weekly chart means expect something nasty...

MARKET BREADTH INDICATORS
The Market Breadth Indicators - "strong" week but the indicators has not really responded. It smells like a short term top. Intermediate term some divergences were erased.
McClellan Oscillator - moved lower for the week and it is barely above zero. Red flag
McClellan Summation Index - buy signal, divergence erased.
Weekly Stochastic of the Summation Index - in overbought territory... we should be near to a top.
Bullish Percentage - buy signal.
Percent of Stocks above MA50 - short term divergence appeared. Red flag
Fear Indicator VIX - complacency everywhere... No divergence, no signs for a significant top.
Advance-Decline Issues - do not confirm the move higher. Obviously fewer and fewer stocks are moving higher.
Percent of Stocks above MA200 - short term divergences erased.
HURST CYCLES
At least a week to reach the middle of the current 40 day cycle. This aligns with the short term forecast.
The 20 week cycle low is barely visible - the 40 week cycle is the dominant. There is more upside. In mid August we will watch for a possible top for the current 20 week and 40 week cycle.
Tom Demark SEQUENTIAL AND COUNTDOWN - this technique spots areas of exhaustion.
The countdown will be finished. Wait for a price flip, this should be a good entry if you want to trade the pullback.
Intermediate term view - pullback and final move higher before more significant correction.
Well I was wrong!!! I was expecting ending diagonal wave 4 and 20 week cycle low before another move higher.... all we have got was small wave 4 of a lower degree. The pattern which I was tracking has changed but not dramatically, the main idea stays the same.
What I think we will see is a dip and another high, followed by a pullback 3%-4%, another high and than more significant correction. The next 3-4 weeks should be ok for the bulls but after that in August we should be very cautious. I see wedges and waves 4 and 5 on all time frames... it is scary a little bit:) a correction lower should be very sharp.
Why the prediction above:
- Elliot waves - what I see is wave 4 and 5(the first chart) to finish wave 3 and than we should see 4 and 5 of a bigger degree(the second chart) to finish 3(or 5) of even bigger degree. Final waves higher on all time frames....
- Cycles - the low for last 20 week cycle was barely visible which means for me the bigger cycle the 40 week cycle is the dominant. It has average size 30-35 weeks with 4-5 weeks the phase to the downside. Currently it is 22 weeks old which means min 4-5 weeks and max 7-8 weeks higher. Another 4-5 weeks higher will fit with the EW analysis before significant correction and we will enter the period which is statistically the weakest - mid August-September to the end of October.
- Market breadth - short term I see weakness. SP500 moved 25 points higher and McClellan Oscillator 7,50 points lower and it is barely above zero - big red flag for the short term. Intermediate term some divergences were erased. My interpretation is that we should see a pullback and another high with divergences before a significant top. The same message repeats....
- Indicators - the price is still above MA50 on daily and weekly - the trend is still up. We see higher lows and higher highs - the up trend is intact.
We see MACD divergences on the daily and weekly chart. Weekly - it can last for a while before it kicks in so there is no problem to see a correction later and we should look for signs on the daily chart. The Daily chart - the MACD peaks are not far from each other. Most of the time such divergences are warnings for a top but not a significant top. In EW terms such divergence usually appear when wave 3 is finishing(expect 4 and 5). It is a warning sign but such a low tests MA50 and usually is been bought. After that if you see a lower high or higher high with even bigger divergence - this is the high which you should sell. Short said the same message like above....
That is what I see. I hope the information is helpful:)
TECHNICAL PICTURE
Short term - MACD divergence.... good for a 10 points dip.

Intermediate term - still waiting for a pullback to MA50... or wave 4 in EW terms.

Long term - I do not think that any move higher will clear the MACD divergence and start another long lasting rally. I think the next big move will be lower, but it could last months until we reach this point. Do not fall asleep, double MACD divergence on the weekly chart means expect something nasty...

MARKET BREADTH INDICATORS
The Market Breadth Indicators - "strong" week but the indicators has not really responded. It smells like a short term top. Intermediate term some divergences were erased.
McClellan Oscillator - moved lower for the week and it is barely above zero. Red flag
McClellan Summation Index - buy signal, divergence erased.
Weekly Stochastic of the Summation Index - in overbought territory... we should be near to a top.
Bullish Percentage - buy signal.
Percent of Stocks above MA50 - short term divergence appeared. Red flag
Fear Indicator VIX - complacency everywhere... No divergence, no signs for a significant top.
Advance-Decline Issues - do not confirm the move higher. Obviously fewer and fewer stocks are moving higher.
Percent of Stocks above MA200 - short term divergences erased.
HURST CYCLES
At least a week to reach the middle of the current 40 day cycle. This aligns with the short term forecast.

The 20 week cycle low is barely visible - the 40 week cycle is the dominant. There is more upside. In mid August we will watch for a possible top for the current 20 week and 40 week cycle.

Tom Demark SEQUENTIAL AND COUNTDOWN - this technique spots areas of exhaustion.
The countdown will be finished. Wait for a price flip, this should be a good entry if you want to trade the pullback.

Jul 2, 2014
Update
The short term structure has changed... but the bigger picture stays the same. My intermediate term forecast has not changed - when this wave is finished pullback to 1925-1910 and another all time high.
What I think we know after yesterday:
- the 20 week cycle low is probably behind us and the current one will carry the prices higher for a while...
- from EW point of view the structure needs more time to finish all the moves... probably another week
- short term I think there will be one more dip to buy and another higher high to around 1985.
The move can be counted different ways. Given the price action today I think the yellow scenario has much higher probability. The white one if we see something deeper to the downside.
 The final wave for the move since mid April decided to extend(ED?), but this does not change the big picture.


Subscribe to:
Posts (Atom)