Now we have the expected pattern and cycles look on time so if the indices continue to follow the forecast we should see move lower in the next two weeks. I think at least the low should be tested with deep retracement. Interesting is so far the indices follow the same path like in 2007, lets see if the low will be tested like in 2007
TECHNICAL PICTURE and ELLIOTT WAVES
Short term - the pattern is nearing completition and something lower should start next week.
Intermediate term - I am expecting the low to be tested and higher into July/August.
Long term - zig-zag(from 2020) for y/B at 9y cycle high 2000-2007-2015-2024.
MARKET BREADTH INDICATORS
Market Breadth Indicators - turned higher and maybe divergences later if the low is being tested.
McClellan Oscillator - very overbought level.
McClellan Summation Index - buy signal.
Weekly Stochastic of the Summation Index - buy signal.
Bullish Percentage - turned higher.
Percent of Stocks above MA50 - turned higher.
Advance-Decline Issues - turned higher.
Fear Indicator VIX - retracing lower.
HURST CYCLES
Short term cycles - at least 20d/5w high which could be 20w high too and next is decline into 5w low.
The indices are in the time band for 40w cycle low (maybe it was in April), next is move higher into 40w high.
Тrading diary / Position trading, Swing trading, Daily trading / Technical analysis Дневник / Практическо приложение на технически анализ / Споделяне на идеи
Apr 26, 2025
Apr 17, 2025
Quick update
It is Easter this weekend so just a quick update... in fact nothing much to update. Short term the move higher continues as expected. Intermediate term I expect one more push lower to complete the decline.
Short term pattern - this week looks like the expected corrective price action in the middle of this move higher.
Short term cycles from 20d to 20w cycle highs and lows. It looks perfect now waiting to see if it will play out.
Apr 12, 2025
Weekly preview
A lot of volatility... which makes forecasting difficult. Short term we saw up/down/big up - I still think this should be the expected a-b with c-wave to follow. BUT the minimum down target has been reached and we have big bar up so there is a posibility the decline is completed... because of the speed of the decline it could have already burned all the fuel.
- Pattern - I see five legs lower which can not be counted as impulse so we should see one more leg lower.... but you can say it started in February so we have completed zig-zag and it is over or for some indices like NYSE it could be this zig-zag with triangle b-wave
- Cycles - if the cycles are moving with average length the indices are close to 20w high and one more 5w cycle lower to complete the decline. This case is shown on the daily cycle chart below and visually looks perfect. But usualy the higs/lows are at pattern higs/lows not at small degree(not size) waves and when you have such fast moves usualy the cycles are shorter taking less time.
- Market breadth - no BUT we should see one more leg lower. When you see such extremes VIX,McClellan Oscillator for example this is not THE low expect one more low with diveergence.
The signs are pointing to one more leg lower with some doubts, next week we should know more.
TECHNICAL PICTURE and ELLIOTT WAVES
Short term - completed a-wave as impulse or the whole decline (alternate zig-zag w-x in red). Now something higher b-wave or the first leg up.
Intermediate term - if we have one more leg lower target should be the next support level and MA200 weekly.
Long term - zig-zag(from 2020) for y/B at 9y cycle high 2000-2007-2015-2024.
MARKET BREADTH INDICATORS
Market Breadth Indicators - bounce higher from oversold levels.
McClellan Oscillator - turned higher from oversold level.
McClellan Summation Index - sell signal.
Weekly Stochastic of the Summation Index - sell signal.
Bullish Percentage - turned higher from oversold level.
Percent of Stocks above MA50 - turned higher from oversold level.
Advance-Decline Issues - turned higher from oversold level.
Fear Indicator VIX - retracing lower from extreme level.
HURST CYCLES
Short term cycles - week/week and a half for 5w high and potential 20w high. Visually this looks great, as I wrote my concern is the speed of the decline.
The indices are in the time band for 40w cycle low, average length is 32-36 weeks. It is very likely this is a low from a higher degree even 4y cycle low.
Apr 5, 2025
Weekly preview
The market took the shorcut and continued lower. I did not expected to be straight line lower to the important trend lines(see daily weekly), but it is what it is.
Those who were two greedy and did not took seriously the charts and the completed pattern were punished. Maybe insults and rants will help next time.
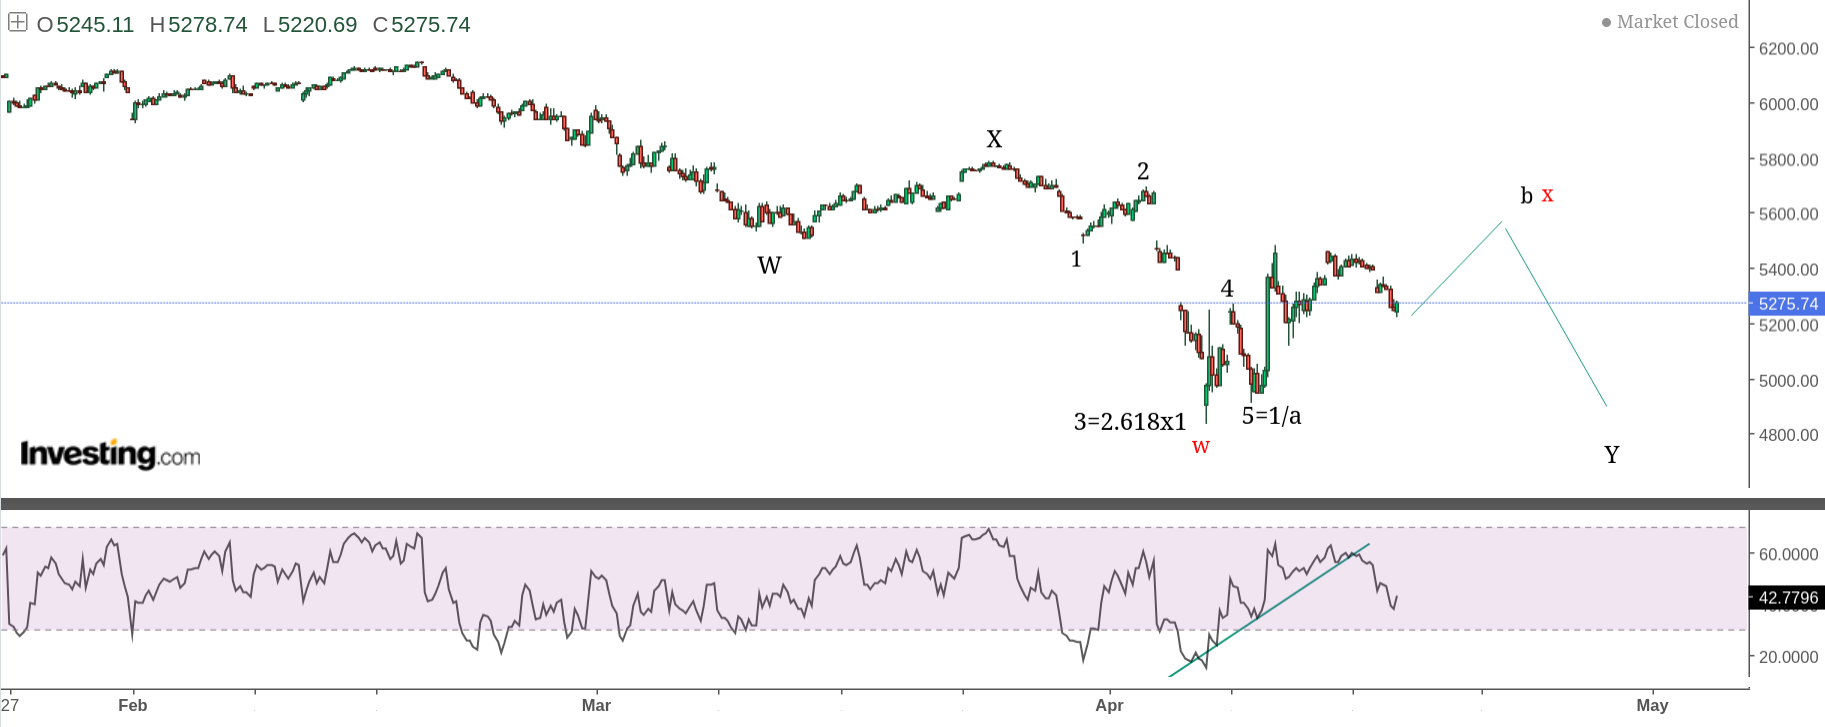
Short term - waves 4-5 to complete impulse will fit best.
Intermediate term - you can count a-b-c from the February high or w-x-y from the December high. I preffer w-x-y because most of the other indices like NYSE,SPXEW,DJ made a high late November, in November you have the 40w cycle high, and this decline did not occur suddenly it was building for months.
Long term - most of the EW guys count this as wave 4 from the 2020 low... I am sceptical, it has to be expanding ending diagonal very rare pattern and the next wave higher should be bigger than the last one - not very likely. On the weekly chart the RSI trend line from 2020 was broken and it moved below 30 into oversold territory - this is not how wave 4 behaves.
TECHNICAL PICTURE and ELLIOTT WAVES
Short term - waves 4-5 to complete impulse lower.
Intermediate term - based on other indices the most likely pattern is w-x-y. If you look at NYSE,SPXEW,DJ you have 5 legs from the top, but you can not count impulse so most likely we will see 7 legs for the usual double zig-zag. SPX - from the top early December expanded flat w-wave, zig-zag X and 20w high and now a-b-c zig-zag for y-wave and a low around support and the trend line line from 2020.
Long term - zig-zag(from 2020) for y/B at 9y cycle high 2000-2007-2015-2024.
MARKET BREADTH INDICATORS
Market Breadth Indicators - now we have some oversold levels, but some divergences too.
McClellan Oscillator - below zero.
McClellan Summation Index - sell signal and divergence.
Weekly Stochastic of the Summation Index - sell signal and divergence.
Bullish Percentage - oversold level.
Percent of Stocks above MA50 - oversold level.
Advance-Decline Issues - divergence.
Fear Indicator VIX - spike higher.
HURST CYCLES
Short term cycles - 2-3 days higher for wave 4 and 20d high then another 2-3 days lower for wave 5 and 20d low will fit perfect.
I think we have 20w high late March and now heading lower into 20w low.
The indices are in the time band for 40w cycle low, average length is 32-36 weeks. Probably it will take a few more weeks and it is likely this is a low from a higher degree.