Trading trigger - neutral signal, up and down around the MA.
Analysis - 18m high turning lower into 18m low.
P.S. - for a trade both analysis and trigger should point in the same direction.

TECHNICAL PICTURE and ELLIOTT WAVES
Short term - it still looks like w4, but only for SPX/NDX. NYSE/DJ have different pattern - waiting to see how the top will look like.

Intermediate term - some kind of topping pattern testing the top with divergence.

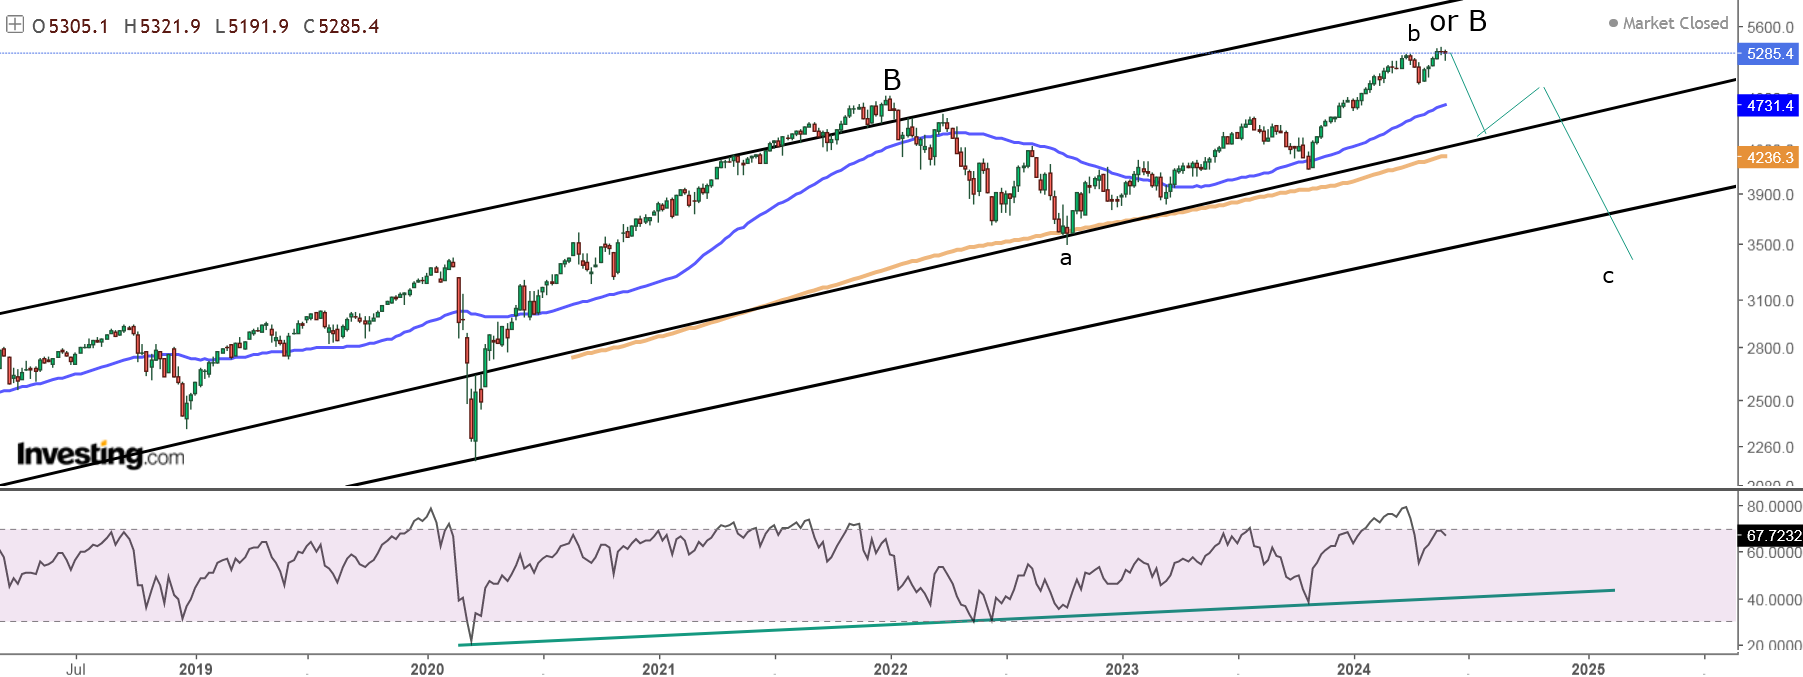
Long term - 4y cycle high the end of 2021, now a-b-c lower into 4y cycle low. Alternate this is the top of wave-B from 2009.
MARKET BREADTH INDICATORS
Market Breadth Indicators - oscillators turned higher, mixed signals, overall weak with divergences.
McClellan Oscillator - around the zero.
McClellan Summation Index - sell signal with double divergence.
Weekly Stochastic of the Summation Index - buy signal.
Bullish Percentage - pointing lower.
Percent of Stocks above MA50 - pointing higher.
Advance-Decline Issues - turned higher, in the middle of the range.
Fear Indicator VIX - double bottom.
HURST CYCLES
Short term cycles - maybe some very extended 5w/10w cycles in both directions....
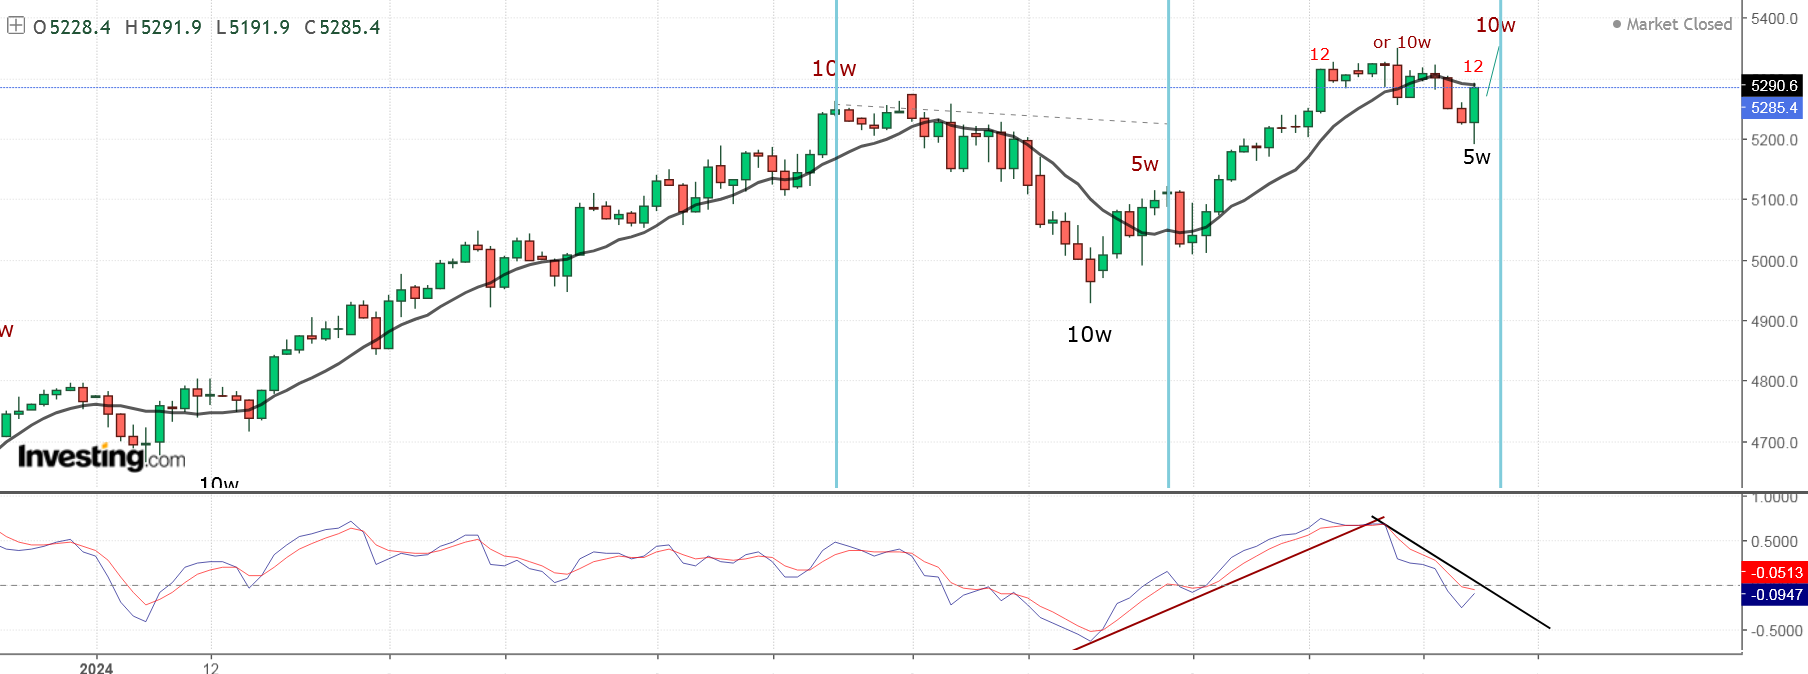
At 18m high, the cycles 10w/20w/40w deviate from the usual length. Last week I have talked about shorter 40w cycles... if the indices continue with this rhytm we should see 18m low short before the US elections.

thank you krasi. maybe we just completed wave a of a larger wave A decline which should be followed by a wave b retrace this week. could retest the ath or even slighlty exceed it in spx case (irregular b). this would reconcile the spx/ndx mild decline with the dow/nyse more aggressive decline so far.
ReplyDeleteJP
wave b retrace is underway. may have completed a and b so far. still to go c, d and e in a ED /rising wedge or simply c. should top by wednesday/thursday as long as friday's low is not violated.
DeleteJP
maybe 5370-75 es by friday nfp scam gap up to complete wave b (irregular). dow retrace is extremely weak which confirms this is a wave b not a wave 5 in both indices. wave c of A should follow next week and should be brutal.
DeleteJP
f, g, h also ahead
Deletewhy don't you go pee on another tree at your gutter level
DeleteJP
Krase, Sentient trader had been looking for the 18m cycle low this June for many months. He has abandoned that thesis and is now looking for a 40w low later this year. Merriman was the only cycle analyst I know who was looking for a 4 year cycle high in April/May.
ReplyDeleteMerriman says:
“ over 90% of four-year U.S. stock market cycles since 1893 have topped out by their 49th month. May is the 50th month since the 4-year cycle began with the “COVID-19 Pandemic Panic of March 2020.” Furthermore, the 4-year cycle trough has occurred by the 56th month in over 90% of those cases. Thus, the U.S. stock market is due for both a crest and a trough within the next six months, and the crest will happen first.”
It seems counterintuitive to me that the 4 year cycle high and low would be only 6 months apart. But he has been right so far with his call for a high in April/May.
I do not watch Sentient trader anymore. He is sticking to the theory so I am sure he is confused when the cycles do not follow the rules.
DeleteMerriman - it is not a problem to have high/low or low/high in a short time span. It happens when the market is very bullish or bearish and the move in the opposite direction is short living
He counts the 2020 high as 4y high and now the next one is due. Every 2 years we have important high and he takes the price high.
I see it different - the highs/lows are at pattern low/high which is not necessarily the price high/low and the 4y cycle is shifted with 2 years.
His count means bullish right translated cycle and continuation and I think it is the opposite bearish 4y cycle high next year.
Went down now moving up….please adjust your chart again, and again
ReplyDeleteThere is nothing to adjust.
DeleteLooks incredibly strong. Like wave 3 starting. You sure Nasdaq isn’t going to double from here? Ai is going to bring down inflation.
DeleteAbsolutely - the markets are going to reach the sky ....
Delete@Anonymous you are really delusional....
DeleteThere's those T+1 screwups. Perfect timing ...
ReplyDeleteKrasi, it looks w5, so new ATH?
ReplyDeleteKrasi, the TLT Monthly chart has from 2020 - 2023 formed a large 5-leg wave down. Could the price action since the 4th quarter of 2022, taking into account EW and/or cycles, be forming an inverse H&S pattern that if confirmed, would minimally project to an approximate 50% retracement of the aforementioned 5-leg pattern? Thanks much.
ReplyDeleteThank You and that i have a super present: Who Repair House Windows in house renovations
ReplyDelete