Happy New Year!!!!
All assets show similar pattern - we have 4y cycle high behind us and in 2023 we should see the final declines into 4y cycle low.
The current view for the next 6 months:
- Stocks - one more push higher then final leg lower for 4 year cycle low.
- Bonds - after one sell off the move higher into 4 year cycle high will continue.
- USD - maybe we saw the high, but when we see fear and all the other asset classes sell off, I expect strong move higher even if it is a lower high.
- Precious metals/miners - final leg lower and 9 year cycle low.
- Crude Oil - the correction lower to continue.
- STOCKS
I think the correction could last until March/April for 18m high, but the trend is lower for 4 year cycle low.
- BONDS
we saw one final flush lower and 4 year cycle low now moving higher into 4 year cycle high.
- FOREX
I was expecting to see the high and it seems we have a reversal. Next year we should see fear which means spike higher for the USD probably lower high then the bigger decline begins.... I guess something like this(EUR/USD chart).
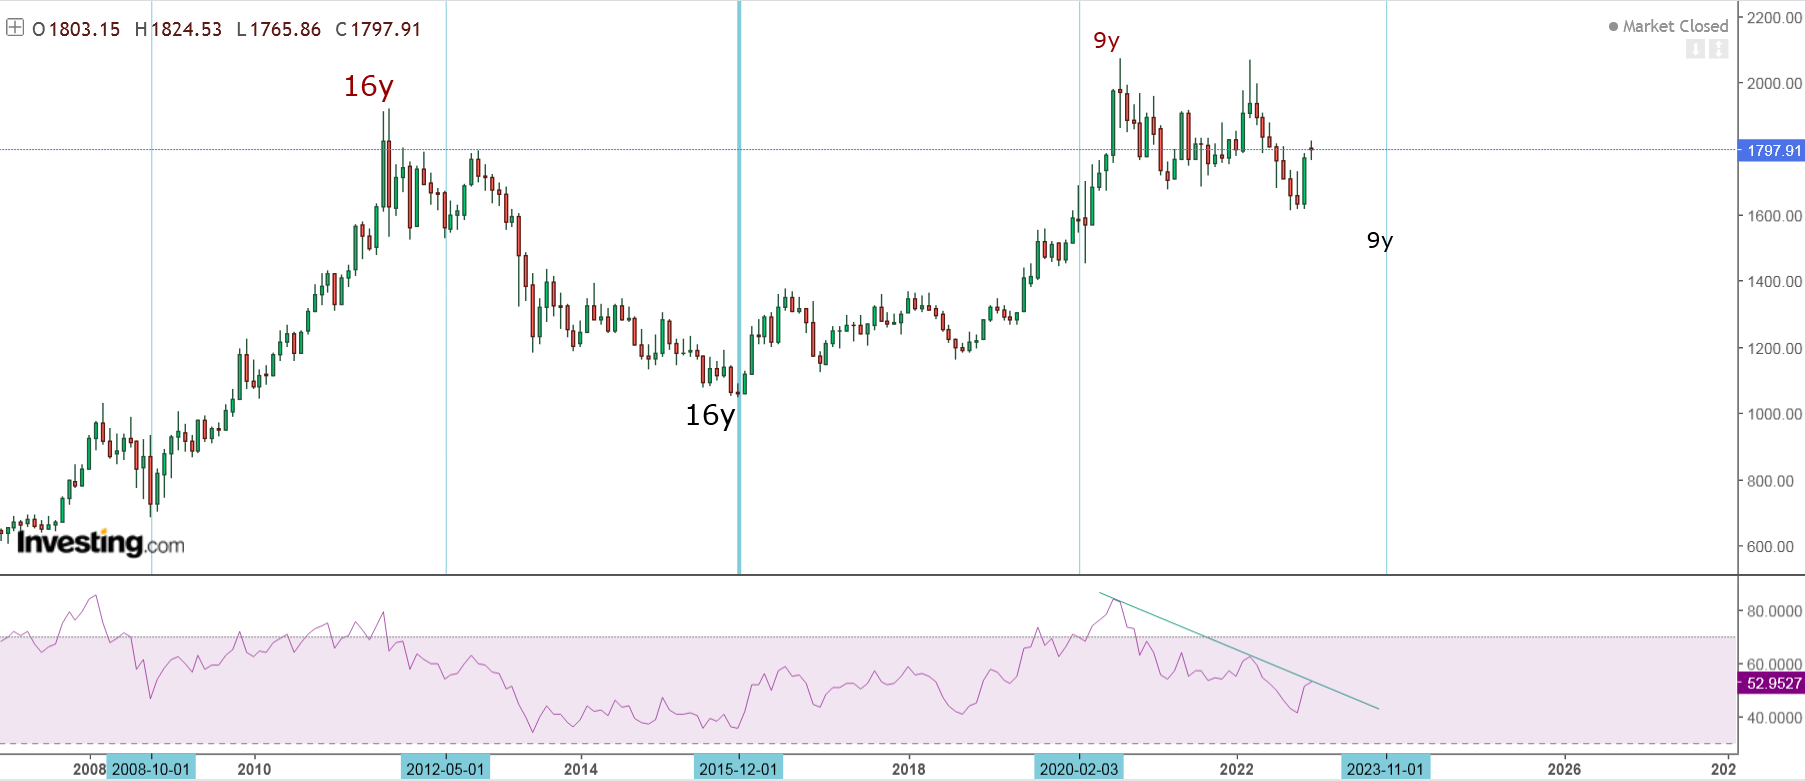
- GOLD/SILVER/MINERS
Gold - the bigger trend is lower until we see the 4y/9y cycle low. Very strong November it looks like reversal, but it will be strange to see the 4y low in just 2.5 years.
In fact the 9y cycle counts visually better if you divide it in three 3x2.6 years roughly 7.5-8 years, but the result is exactly the same Q4.2023 - the average length for 9y cycle.
GDXJ - miners the same cycle pattern we should see one final decline for 9 year cycle low and completed double zig-zag.
Closer look - perfect pattern with Fibo measurements price and time looks like this:
- CRUDE OIL
We saw a high as expected, this should be 4 year cycle high and now declining into 4 year cycle low.


Thank you very much
ReplyDeleteI don't understand your eur/usd analysis.
ReplyDeleteIf spx goes down until 2024, eur-usd too. And dollar should go up.
Yes, when we see fear assets are sinking and the USD is rising(eur-usd is lower).
Delete
DeleteSo why does it say on your chart that the euro goes up until early 2024?
On my chart eur-usd is making one more low in 2023 and not straight up until early 2024.
DeleteHello Krasi,Happy new year, what do you think about Natural Gas?
ReplyDeleteThis year the zig-zag lower should be completed and time 4 years from the previous important low..... so the same as everything else.
DeleteBreakout of ascending triangle for GDX (daily chart). Just need volume confirmation. Giddy-up!
ReplyDeleteLooks like a triangle for b, c up to 4k for mid January
ReplyDeleteMaybe just another reset of indicators/oscillators to set up a retest of the prior short-term low, for a bullish divergence to price?
DeleteWhen do you expect 4y low in stocks? Is it the purple line indicating 18m/4y low towards the end of 2023?
ReplyDeleteI expect it in October 2023
DeleteIf October 2022 was 18m low then 4y low in Q1 2024, 14-16 months
DeleteOr the 18m low was in June 2022
Delete