Feb 25, 2023

Weekly preview

Lower as expected, but the market gave us some new information. When you expect final move higher/lower to complete 20w high/low cycle and you see three weeks in the opposite direction.... it is over. From pattern perspective if there is more to the upside the possible patterns are triple zig-zag very rare or ED rare with questionable shape(very short wave 2).
Short said the probability for higher high is very very low.

The current move lower is big and long enough to be comparable with the previous two legs - down and up so it is of the same degree. I am excluding the option for continuation(explained above). On the other side it is moving slowly compared with the last move up(from the December low). This means most likely this is not a reversal but part of a bigger pattern. Short said wave b/B is running shown on the daily chart. This will fit perfect with 18m cycle low in October and 40w cycle low when wave b/B completes in 2-3 months.
There is surprise pattern triangle which fits with 18m cycle in June looking like this - the triangle ....but first lets see a wave looking like possible d-wave.

The alternate option is the move higher is over(the B-wave).... but again so far this leg lower is moving slowly. If it accelerates it will become the primary scenario.


TRADING
Trading trigger - sell signal, declining into daily cycle low.
Analysis - long term sell the rips, we have major top. Intermediate term high - lower for two months.

P.S. - for a trade both analysis and trigger should point in the same direction.


TECHNICAL PICTURE and ELLIOTT WAVES
Short term - probably in the middle of the a-wave.


Intermediate term - waiting a few weeks for more clarity. Depending on where you put the low either B is complete or b/B is running.
On the radar - d-wave for B triangle or very low probability - one more high.


Long term - most likely huge double zig-zag from the 2009 low B-wave was completed and multi year decline has started. If we are lucky it is lower degree b-wave.


MARKET BREADTH INDICATORS
Market Breadth Indicators - are moving lower.
McClellan Oscillator - bounce up from oversold level and small divergence.
McClellan Summation Index - sell signal.
Weekly Stochastic of the Summation Index - sell signal.
Bullish Percentage - moving lower.
Percent of Stocks above MA50 - in the middle of the range.
Fear Indicator VIX - weak move higher.
Advance-Decline Issues - trying to turn up.
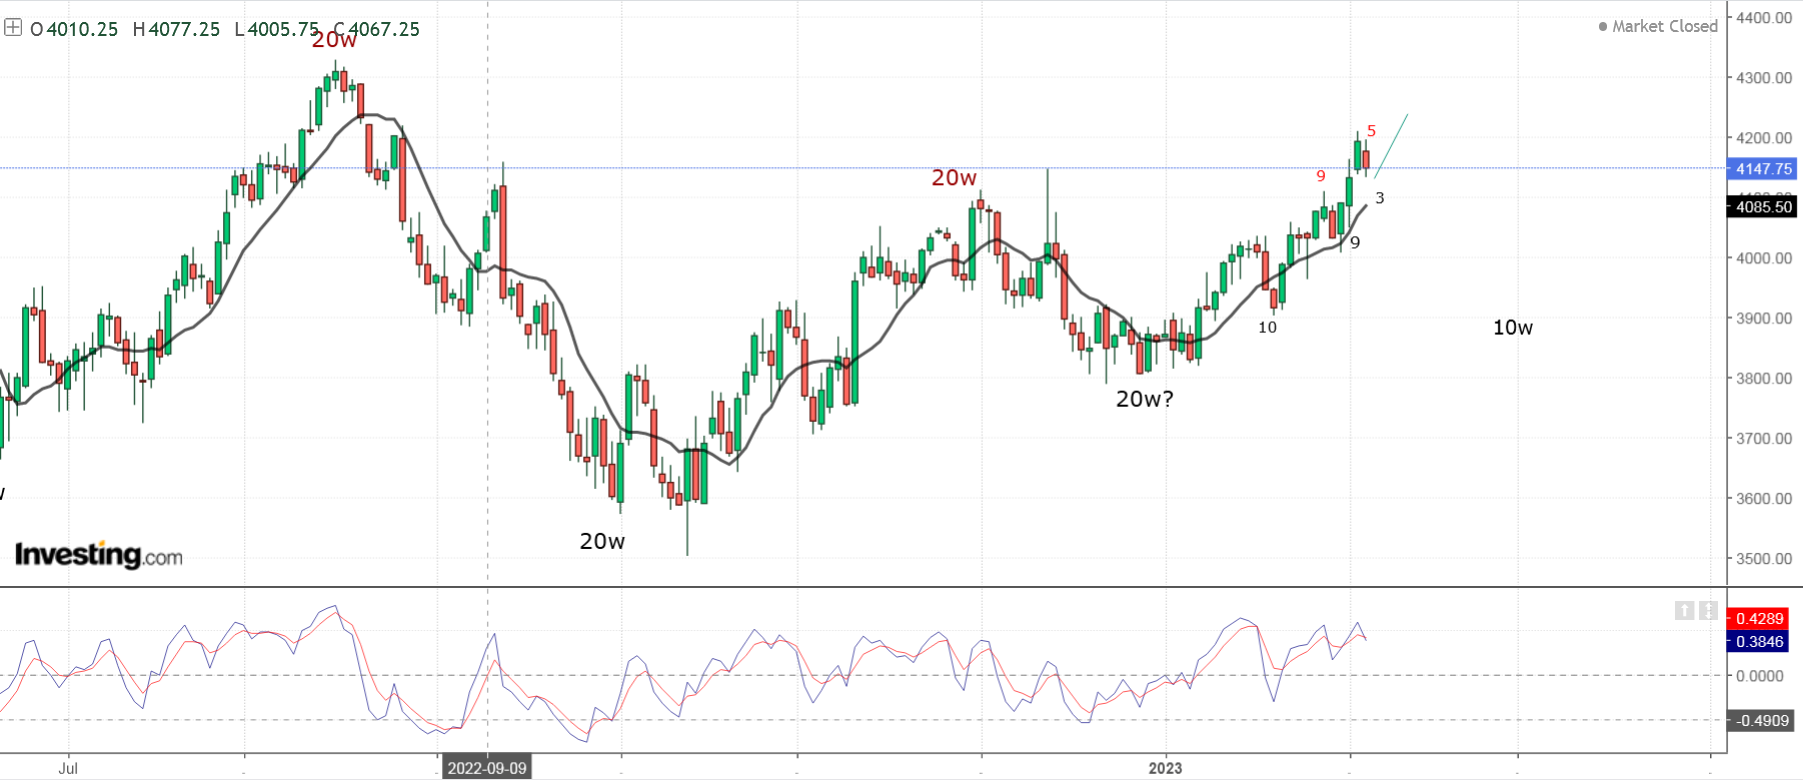

HURST CYCLES
Short term cycles - close to 20d cycle low, next we should see something higher for 20d/5w cycle high.


This is the cycle model with 18m low in October if the B-wave started from this low.
Since that low we do not have clear 20w cycle. To stick to the theory you have to count one very short and one long 20w cycle. Visually the 40w cycle will look like consisting of three shorter cycles and each of them 3x5w long.

Feb 18, 2023

Weekly preview

Higher for 20d cycle high and reversal lower as expected. Next we should see decline into 10w low.
The price action does not look like reversal so the pattern now confirms the cycle analysis that we should see one more high... so sticking to the plan.


TRADING
Trading trigger - sell signal, declining into daily cycle low.
Analysis - long term sell the rips, we have major top. Intermediate term - a few weeks to important high.

P.S. - for a trade both analysis and trigger should point in the same direction.


TECHNICAL PICTURE and ELLIOTT WAVES
Short term - the pattern is taking shape double zig-zag.... what a surprise the same pattern is repeating in the last few years.
Alternate you can count ED for wave-C to complete flat correction from the June low.


Intermediate term - waiting for the top and another zig-zag lower for roughly 6 months. I expect the high in 4-5 weeks.


Long term - most likely huge double zig-zag from the 2009 low B-wave was completed and multi year decline has started. If we are lucky it is lower degree b-wave.


MARKET BREADTH INDICATORS
Market Breadth Indicators - moving lower, based on cycles and pattern the top is not in.
McClellan Oscillator - below zero.
McClellan Summation Index - sell signal.
Weekly Stochastic of the Summation Index - sell signal.
Bullish Percentage - moving lower.
Percent of Stocks above MA50 - turned lower.
Fear Indicator VIX - turned higher.
Advance-Decline Issues - moving lower.


HURST CYCLES
Short term cycles - 20d high and now declining into 20d low which should complete 10w cycle low.


Maybe 20w cycle low next week? Watching the 40w cycle high - it is 27 weeks long so we should see one more 10w cycle high.
Usually the cycle lows are at pattern lows so the 18m low should be in June. The first 18m cycle divides very good in two, the second 18m cycle divides very good in three and the third one looks like a mess - somewhere in the middle of it.

Feb 11, 2023

Weekly preview

We have something lower - is this the top? From pattern perspective we have zig-zag so yes, cycles - high around mid-March will look better, indicators with mixed signals - it could be the top, but we could see divergence later.
I think we have to wait for another month - I do not see confirmation for reversal so far. It looks more like 10w low in a week or two and indicators reset after overbought levels.


TRADING
Trading trigger - sell signal.
Analysis - Analysis - long term sell the rips, we have major top. Intermediate term - close to important high.

P.S. - for a trade both analysis and trigger should point in the same direction.


TECHNICAL PICTURE and ELLIOTT WAVES
Short term - another corrective structure has been completed. Waiting to see the move lower to show us if we have reversal or not.


Intermediate term - waiting for the top and another zig-zag lower for 6 months. Either this is the top or one more high.


Long term - most likely huge double zig-zag from the 2009 low B-wave was completed and multi year decline has started. If we are lucky it is lower degree b-wave.


MARKET BREADTH INDICATORS
Market Breadth Indicators - turned lower some with divergences.
McClellan Oscillator - moving lower after very overbought levels.
McClellan Summation Index - turned lower.
Weekly Stochastic of the Summation Index - overbought level, trying to turn lower.
Bullish Percentage - turned lower and divergence.
Percent of Stocks above MA50 - turned lower and divergence.
Fear Indicator VIX - moving lower.
Advance-Decline Issues - turned lower and divergence.


HURST CYCLES
Short term cycles - probably 20d high next week and maybe three shorter 20d cycles to complete 5w/10w/20w low.


Maybe we have the 20w cycle low in 1-2 weeks... focused on the longer cycles. The 40w cycle high is 26 weeks long so we should see one more 10w cycle.
Usually the cycle lows are at pattern lows so the 18m low should be in June. The first 18m cycle divides very good in two, the second 18m cycle divides very good in three and the third one looks like a mess - somewhere in the middle of it.

Feb 4, 2023

Weekly preview

It did not last long we have the answer, the pattern looks clear - zig-zag lasting 4 months and close to 18m high.
Now the cycles are a mess:) where is the 20w low? - I doubt that we will see a clear one. Is this just a zig-zag or a bigger pattern starting in June - where to put the 18m low?
All this is important from cycle perspective to know where to start counting the next 18m cycle. It does not matter for the outcome - another zig-zag lower to complete 4y cycle low and the decline which started early 2022.


TRADING
Trading trigger - buy signal, time for the next high.
Analysis - long term sell the rips, we have major top. Intermediate term - close to important high.

P.S. - for a trade both analysis and trigger should point in the same direction.


TECHNICAL PICTURE and ELLIOTT WAVES
Short term - complex pattern from the last important low. There is many possible combinations I am showing this because it is in sync with DJI showing more simple pattern and second it is the most common pattern from the last several years - double zig-zag.


Intermediate term - the alternate scenario is playing out. I see leg lower 5.5 months and complex sideways correction which started in June.2022 lasting 7.5 months. Next waiting for the top and another zig-zag lower for 6-8 months.

How to try to fit cycles seaking 20w low - than you nead b/B wave as running/expanded flat(yellow). This does not make much sense because we have a/B lasting 7 weeks and b/b/B lasting 6 weeks. Short said we have rather two legs of the same degree than some sub-wave.
Another option is w4 of diagonal for wave C impulse and the whole pattern is flat from June.... but all this patterns ending diagonal running/expanded flat are rare - if we see it fine, but I would no bet on it before seeing it.


Long term - most likely huge double zig-zag from the 2009 low B-wave was completed and multi year decline has started. If we are lucky it is lower degree b-wave.
Interesting MACD reached the zero line and RSI the trend line.


MARKET BREADTH INDICATORS
Market Breadth Indicators - extremes and divergences, the indices are at important top.
McClellan Oscillator - divergence.
McClellan Summation Index - extreme overbought.
Weekly Stochastic of the Summation Index - buy signal.
Bullish Percentage - divergence.
Percent of Stocks above MA50 - divergence.
Fear Indicator VIX - hit the long term trend line starting in 2017.
Advance-Decline Issues - divergence.


HURST CYCLES
Short term cycles - possible 20d cycle low at day 9 or DJI showing again more simple picture.


Week 16 for 40w cycle starting in October.
Usually the cycle lows are at pattern lows so the 18m low should be in June. The first 18m cycle divides very good in two, the second 18m cycle divides very good in three and the third one looks like a mess. A guess in the moment - count one 20w cycle June-October, count 40w cycle October-April and one final 20w cycle. This will fit perfect with the pattern - like this .... or stick to the theory and try to find the 20w/40w low.