Nov 26, 2022

Weekly preview

Holidays and the indices crawling slowly higher. Now they are close to intermediate term high. The pattern is taking shape looking almost completed all this at MA200 and close to the trend line plus week 15 for the 20w high... so waiting for the high I guess next week.


TRADING
Trading trigger - buy signal.
Analysis - long term sell the rips, we have major top. Intermediate term - close to the next high.

P.S. - for a trade both analysis and trigger should point in the same direction.


TECHNICAL PICTURE and ELLIOTT WAVES
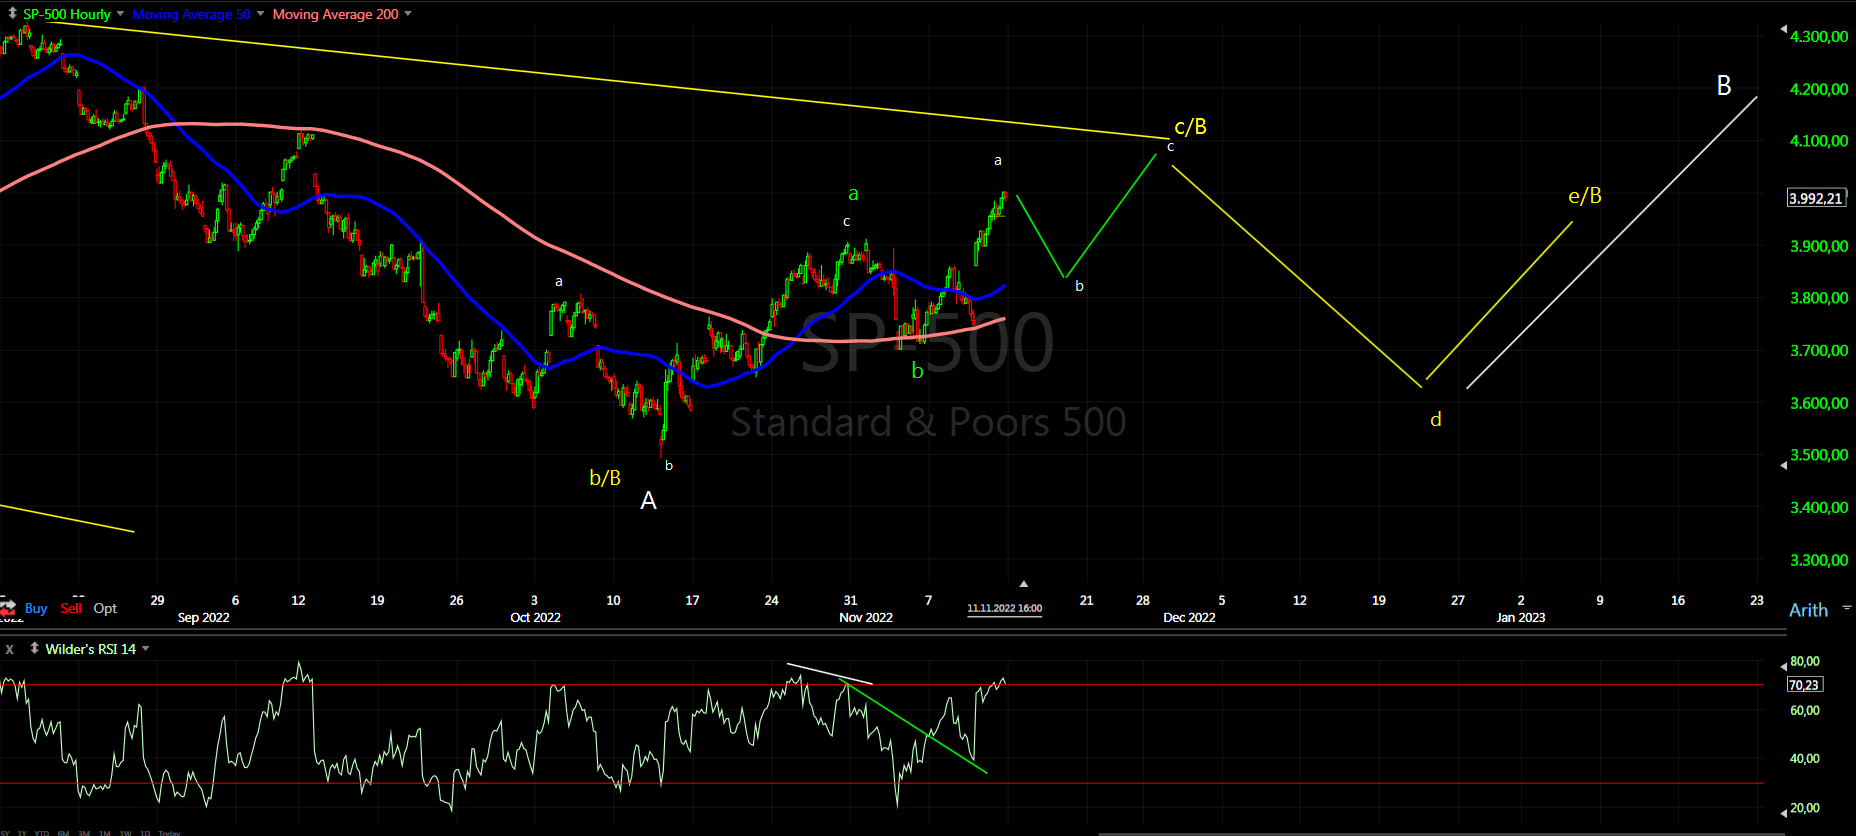
Short term - the pattern looks like a-b-c which is almost completed at MA200.


Intermediate term - the pattern is not clear at the moment, I am watching this two options.
If you step back and look at the big picture you will see move down for 5.5 months and sideways move for almost 5.5 months 1-2 weeks missing. That says it all down and a pause one more down is missing. This move up is weak and corrective - it will be nice to see b-c-waves up next year, but the other options B-wave top or e/B-wave are not so nice... careful with longs.


Long term - most likely huge double zig-zag from the 2009 low B-wave was completed and multi year decline has started. If we are lucky it is lower degree b-wave with c-wave to follow.


MARKET BREADTH INDICATORS
Market Breadth Indicators - some small divergences, still strong levels.
McClellan Oscillator - double divergence.
McClellan Summation Index - buy signal.
Weekly Stochastic of the Summation Index - buy signal.
Bullish Percentage - at the 70 level short term divergence.
Percent of Stocks above MA50 - strong above 75.
Fear Indicator VIX - complacency is back, at the trend line connecting the previous 3 lows.
Advance-Decline Issues - weakness short term divergence.


HURST CYCLES
Short term cycles - 20d low and higher into 20d high. Counting the 20d cycles highs gives us 20w high next week.
The lows are not very clear. As I wrote do not expect to see clear 10w low the 20w cycle is dominant like the previous one. It is just a guess where it is... I am not sure where it starts September or October.


Week 15 for the 20w cycle high very close to the top of this move. Most obvious 18m low is in October... I have the suspicion it could have been in June - where the strong reaction started.

Nov 20, 2022

Weekly preview

Boring week... nothing new. As expected decline into 20d low and possible 10w low. I think we should see one more high for the 20w cycle high.


TRADING
Trading trigger - buy signal.
Analysis - long term sell the rips, we have major top. Intermediate term higher for a few weeks.

P.S. - for a trade both analysis and trigger should point in the same direction.


TECHNICAL PICTURE and ELLIOTT WAVES
Short term - the same like last week - zig-zag higher part of a bigger double zig-zag.


Intermediate term - the pattern is not clear at the moment, I am watching this two options.


Long term - most likely huge double zig-zag from the 2009 low B-wave was completed and multi year decline has started. If we are lucky it is lower degree b-wave with c-wave to follow.


MARKET BREADTH INDICATORS
Market Breadth Indicators - still positive, oscillators turned lower nothing bearish so far.
McClellan Oscillator - close to zero, reseting after overbought levels.
McClellan Summation Index - buy signal.
Weekly Stochastic of the Summation Index - buy signal.
Bullish Percentage - turned lower, around 70.
Percent of Stocks above MA50 - above 75.
Fear Indicator VIX - moving lower with small push higher.
Advance-Decline Issues - between zero and overbought nothing interesting.


HURST CYCLES
Short term cycles - close to 20d low. Maybe one more 20d cycle for 10w low... it depends on which index you are watching - which low you start counting from.


Week 14 for the 20w cycle high. Most obvious 18m low is in October... I have the suspicion it could have been in June.

Nov 12, 2022

Weekly preview

Nothing new to add - short term not very clear pattern and cycles. The bigger picture looks better - with high probability we have 20w low and now higher into 20w cycle high and corrective pattern running for 18m high. Market breadth was very oversold and now resetting - it was a clear sign to expect relief move higher not a crash. The price action is choppy and corrective so it is just that reliaf rally to reset the indicators nothing more.


TRADING
Trading trigger - another cross and buy signal.
Analysis - long term sell the rips, we have major top. Intermediate term low and higher for a while.

P.S. - for a trade both analysis and trigger should point in the same direction.


TECHNICAL PICTURE and ELLIOTT WAVES
Short term - another zig-zag higher. Most likely part of a bigger double zig-zag.


Intermediate term - we have an intermediate tern low, the pattern is not clear at the moment. I am watching this two options.


Long term - most likely huge double zig-zag from the 2009 low B-wave was completed and multi year decline has started. If we are lucky it is lower degree b-wave with c-wave to follow.


MARKET BREADTH INDICATORS
Market Breadth Indicators - showing strength so we have intermediate term low, but the price action is weak. It feels like indicators reset not a reversal.
McClellan Oscillator - strong, but now with divergence.
McClellan Summation Index - buy signal.
Weekly Stochastic of the Summation Index - buy signal.
Bullish Percentage - strong overbought level.
Percent of Stocks above MA50 - strong overbought level.
Fear Indicator VIX - declining.
Advance-Decline Issues - positive, but declining.


HURST CYCLES
Short term cycles - 20d high and next week we should see 20d low. The cycle highs look clear the lows not so much. This is the current... guess - most likely we will not see clear 10w low as with the previous 20w cycle.


Week 13 for the 20w cycle high. RSI confirmed 20w low and now moving higher into 20w high. Most likely 18m low in October. Worst case scenario is counting 18m cycle from October.2021 than the 18m low should be in January.

Nov 5, 2022

Weekly preview

The double zig-zag higher was completed on schedule and now watching the move lower. I am not sure we will see a lower low, it looks less likely. At the moment waiting to see how this move lower will develop.
Intermediate term I do not expect a crash worst case should be final low for 18m cycle low in January.


TRADING
Trading trigger - sell signal.
Analysis - long term sell the rips, we have major top. Intermediate term - one more move lower or bottoming expected.

P.S. - for a trade both analysis and trigger should point in the same direction.


TECHNICAL PICTURE and ELLIOTT WAVES
Short term - completed pattern higher, now watch for another zig-zag lower.


Intermediate term - one final low for wave A, or alternate we saw the low already... maybe we have triangle for wave-B.


Long term - most likely huge double zig-zag from the 2009 low B-wave was completed and multi year decline has started. If we are lucky it is lower degree b-wave with c-wave to follow.


MARKET BREADTH INDICATORS
Market Breadth Indicators - turned lower, but it is not strong sell signal.
McClellan Oscillator - retracing lower after overbought level.
McClellan Summation Index - buy signal.
Weekly Stochastic of the Summation Index - buy signal.
Bullish Percentage - turned lower.
Percent of Stocks above MA50 - turned lower.
Fear Indicator VIX - moving lower.
Advance-Decline Issues - turned lower after overbought level.


HURST CYCLES
Short term cycles - this count looks ligical - 5w high and now decline into 5w low next week.


Week 12 for the 20w cycle high. Week three from the last low it looks like 20w low at week 17(average lenght is 16-18 weeks). It is possible that we have 18m low too. Worst case scenario is counting 18m cycle from October.2021 than the 18m low should be in January.