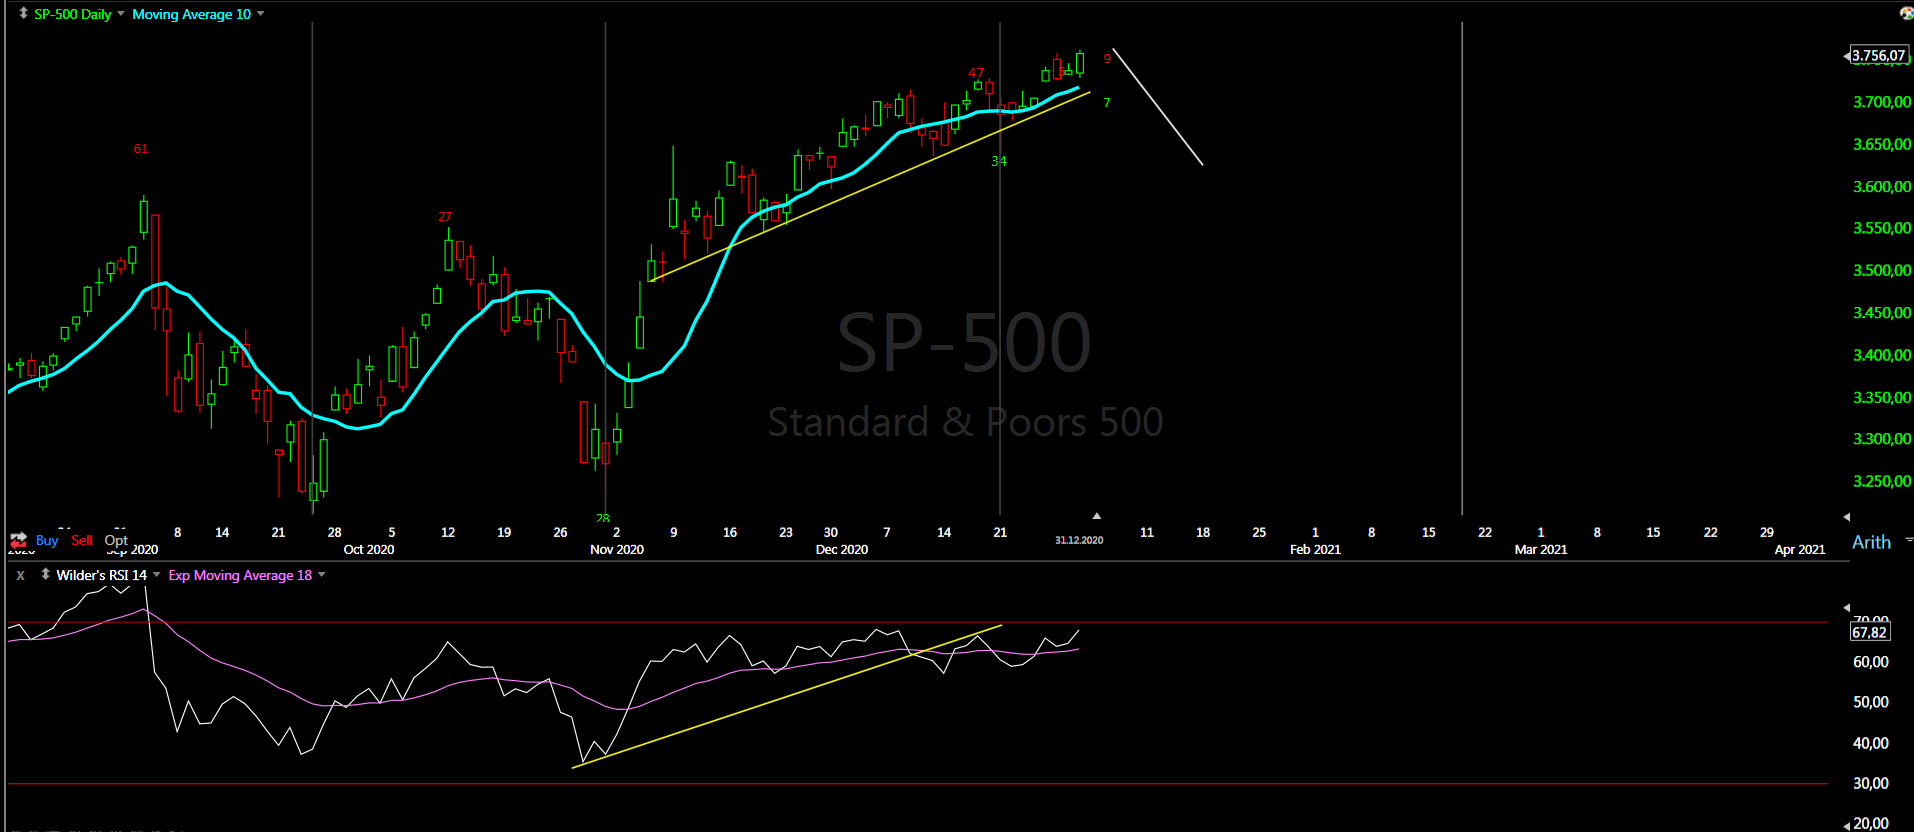
Trading cycle - sell signal. The price is below MA10 for three days and RSI broke below the trend line. We saw a turn lower into daily cycle low, but 26 days is too short another 1-2 weeks lower will look better.

TECHNICAL PICTURE and ELLIOTT WAVES
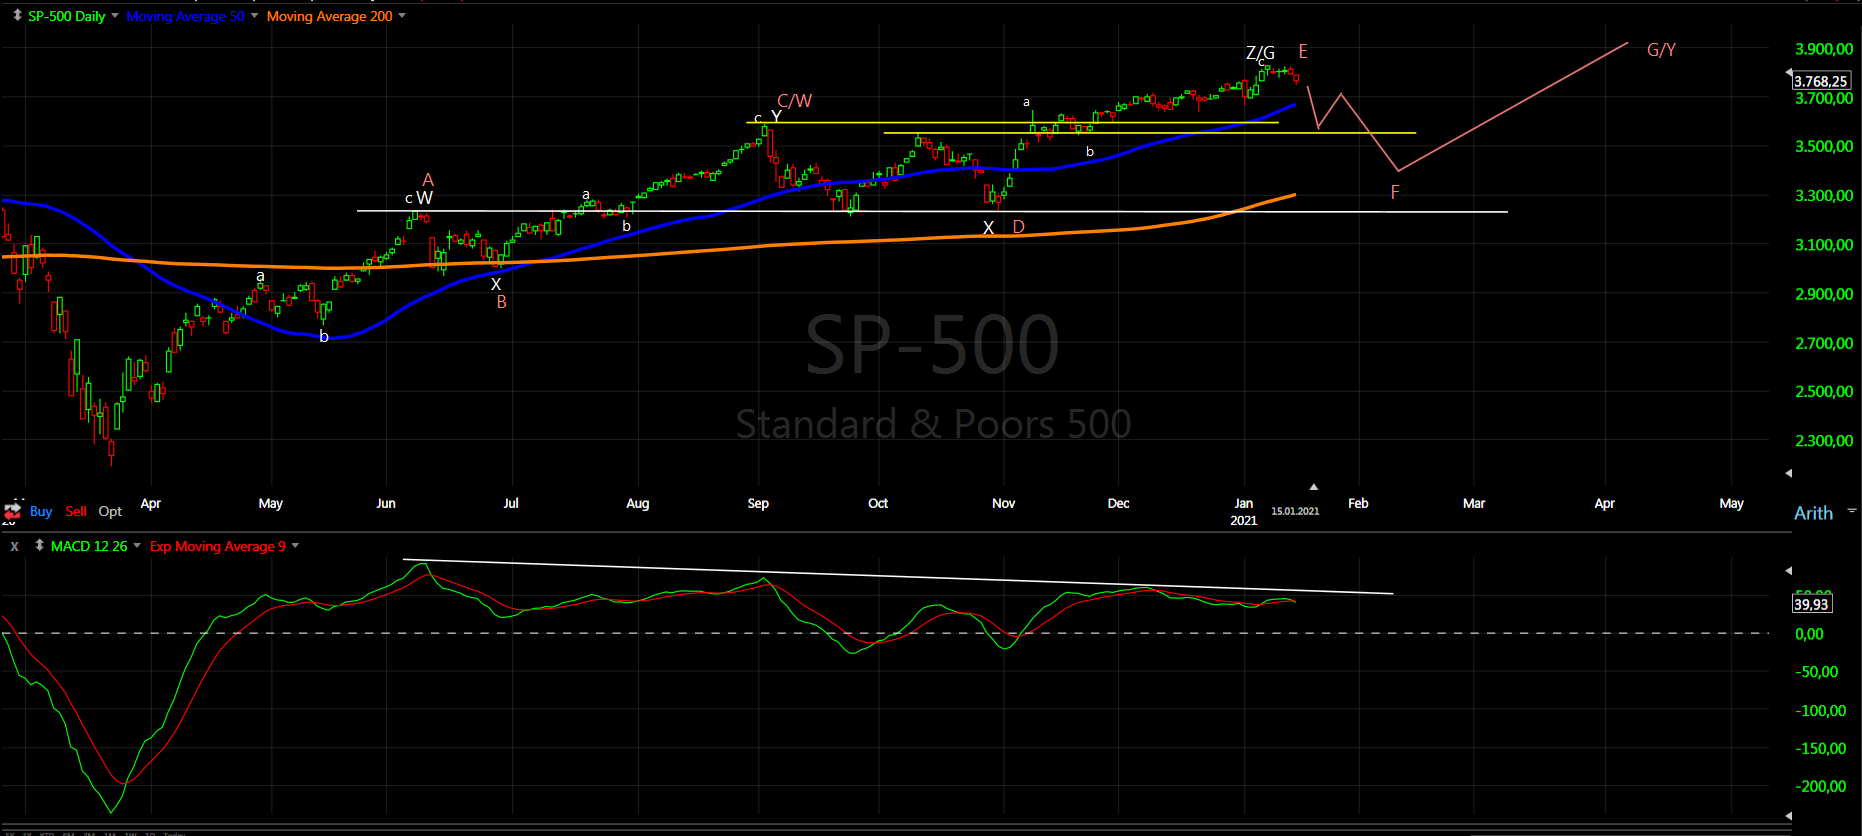
Short term - I see corrective pattern lower... more of this double zig-zags. Smaller one with the white labels for b/f-wave. Bigger one the green a-b-c for B/F-wave.

Intermediate term - waiting to see the size of the decline for the degree of the waves - b/f or B/F.
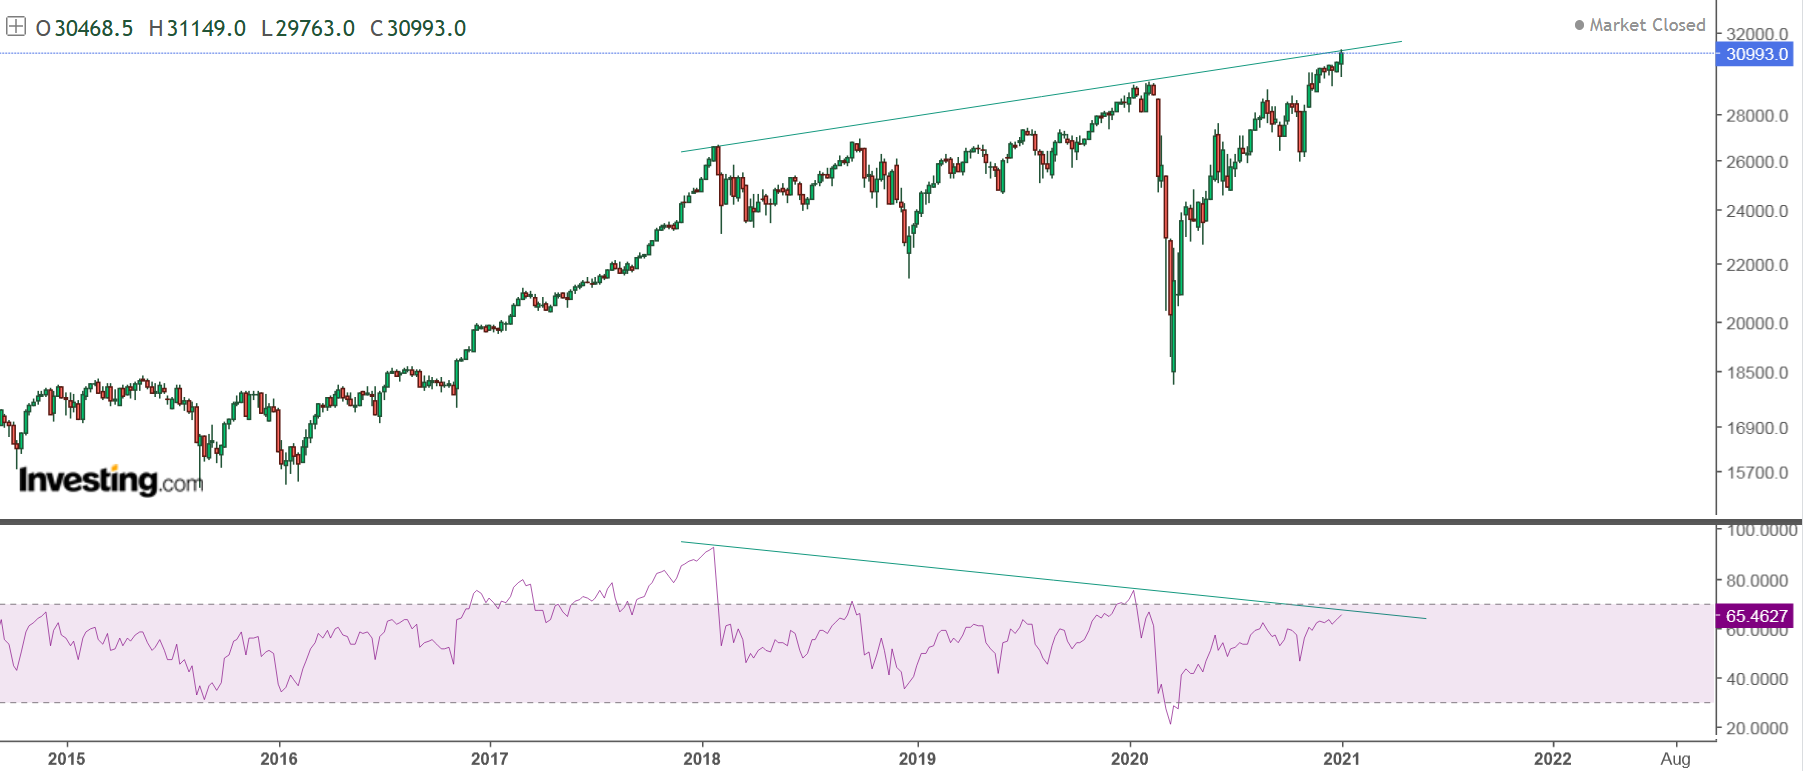
I see only corrective declines so expect one more high to complete the move from the March low. Interesting is if RSI will touch/break the major trend line from the March low - this already occurred on the weekly chart.

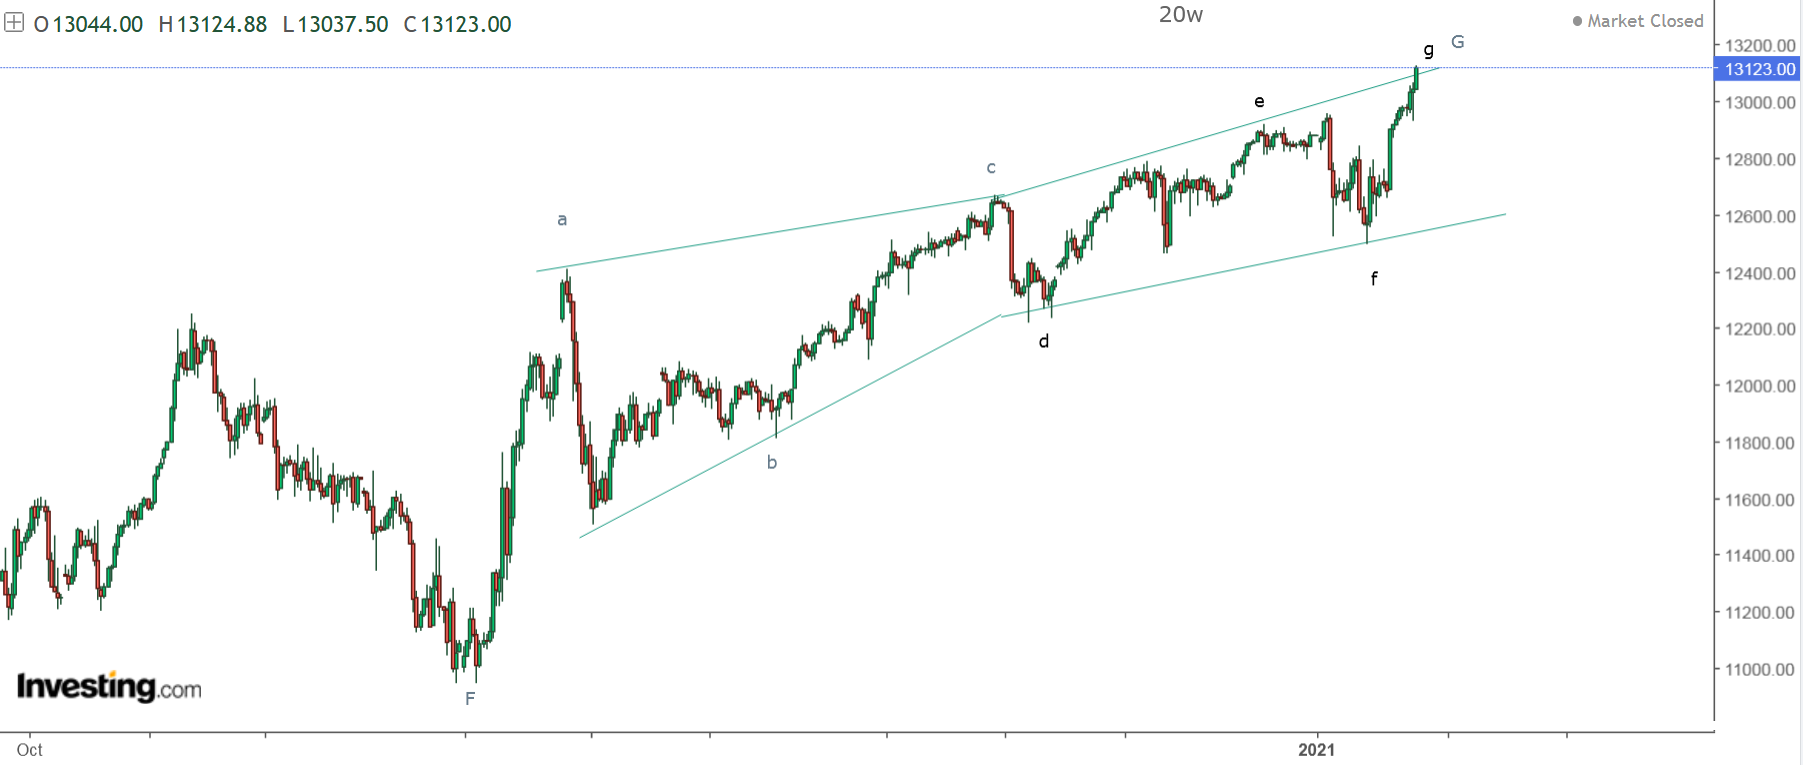
Long term - the bull market completed in 2018. Since then a bunch of corrective waves. Currently I think this rally should be a corrective wave of a bigger pattern most likely triangle. Look at NDX we have corrective wave which is 1,618 bigger than the previous one which could be only b of a triangle. I think the best looking pattern is Neely's triangle.

MARKET BREADTH INDICATORS
Market Breadth Indicators - pointing lower, most of them in the middle of their ranges so no signs for a bottom.
McClellan Oscillator - slightly oversold with small divergence so probably higher for a few days.
McClellan Summation Index - sell signal.
Weekly Stochastic of the Summation Index - sell signal.
Bullish Percentage - in the middle of the range.
Percent of Stocks above MA50 - in the middle of the range.
Fear Indicator VIX - spike higher.
Advance-Decline Issues - in the middle of the range.
HURST CYCLES
Short term cycles - next week we should see 2-3 days up for 20d high, then final turn lower for 20d/5w/10w/20w low.

Week 13 for the 20 week cycle. It turned lower and RSI confirms it.