Trading trigger - buy signal
Analysis - final wave completing the correction and turn lower to complete the 4y cycle low. Intermediate term low and higher for a few weeks, probably into year end.
P.S. - for a trade both analysis and trigger should point in the same direction.

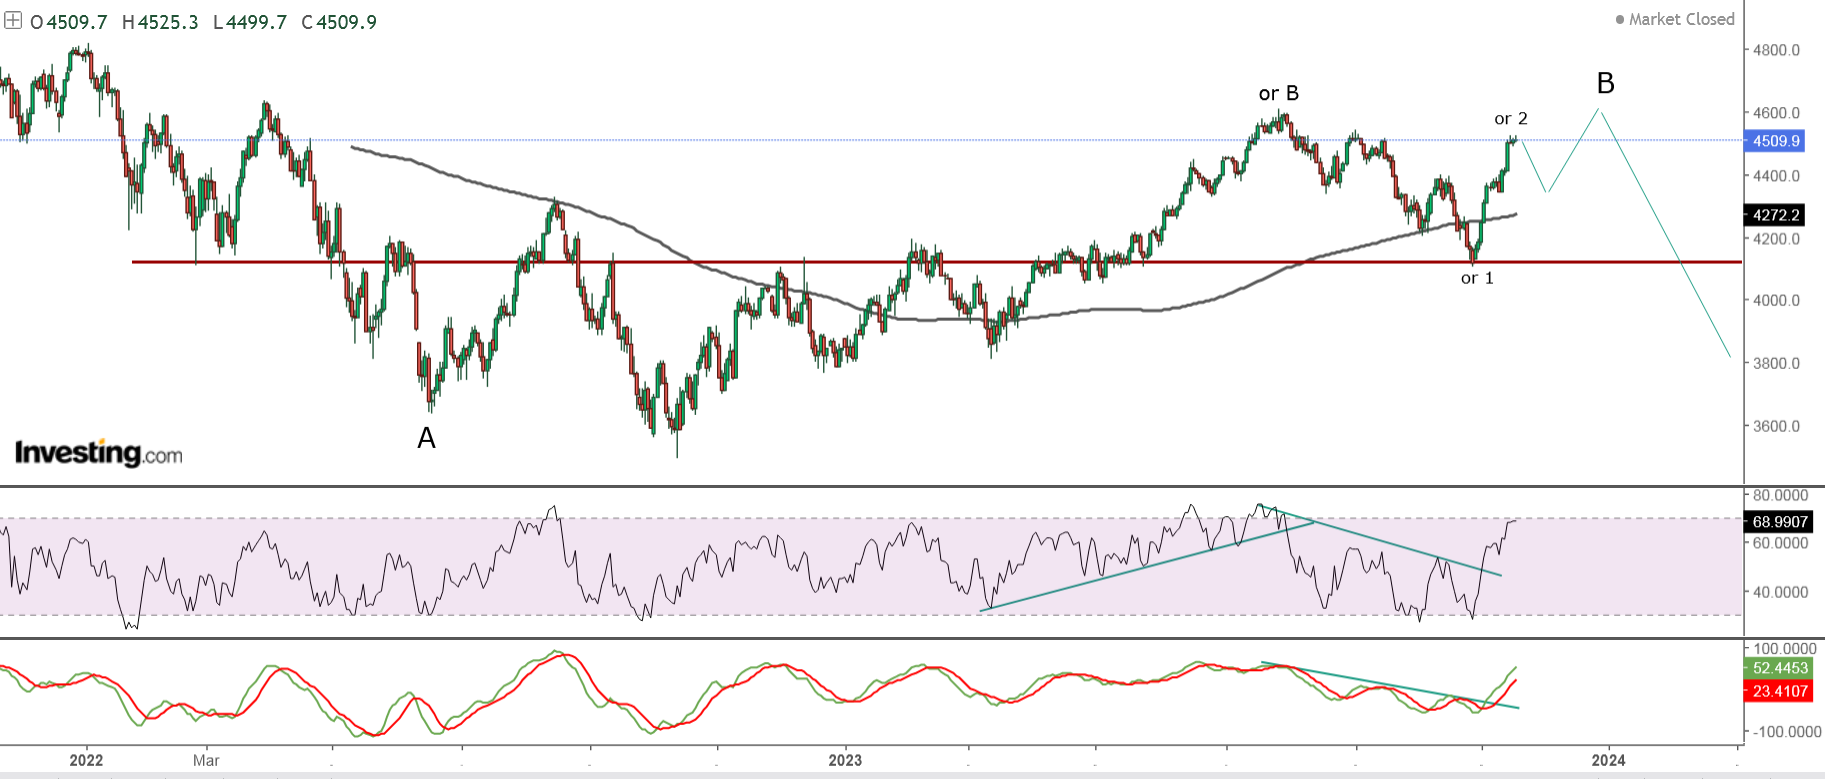
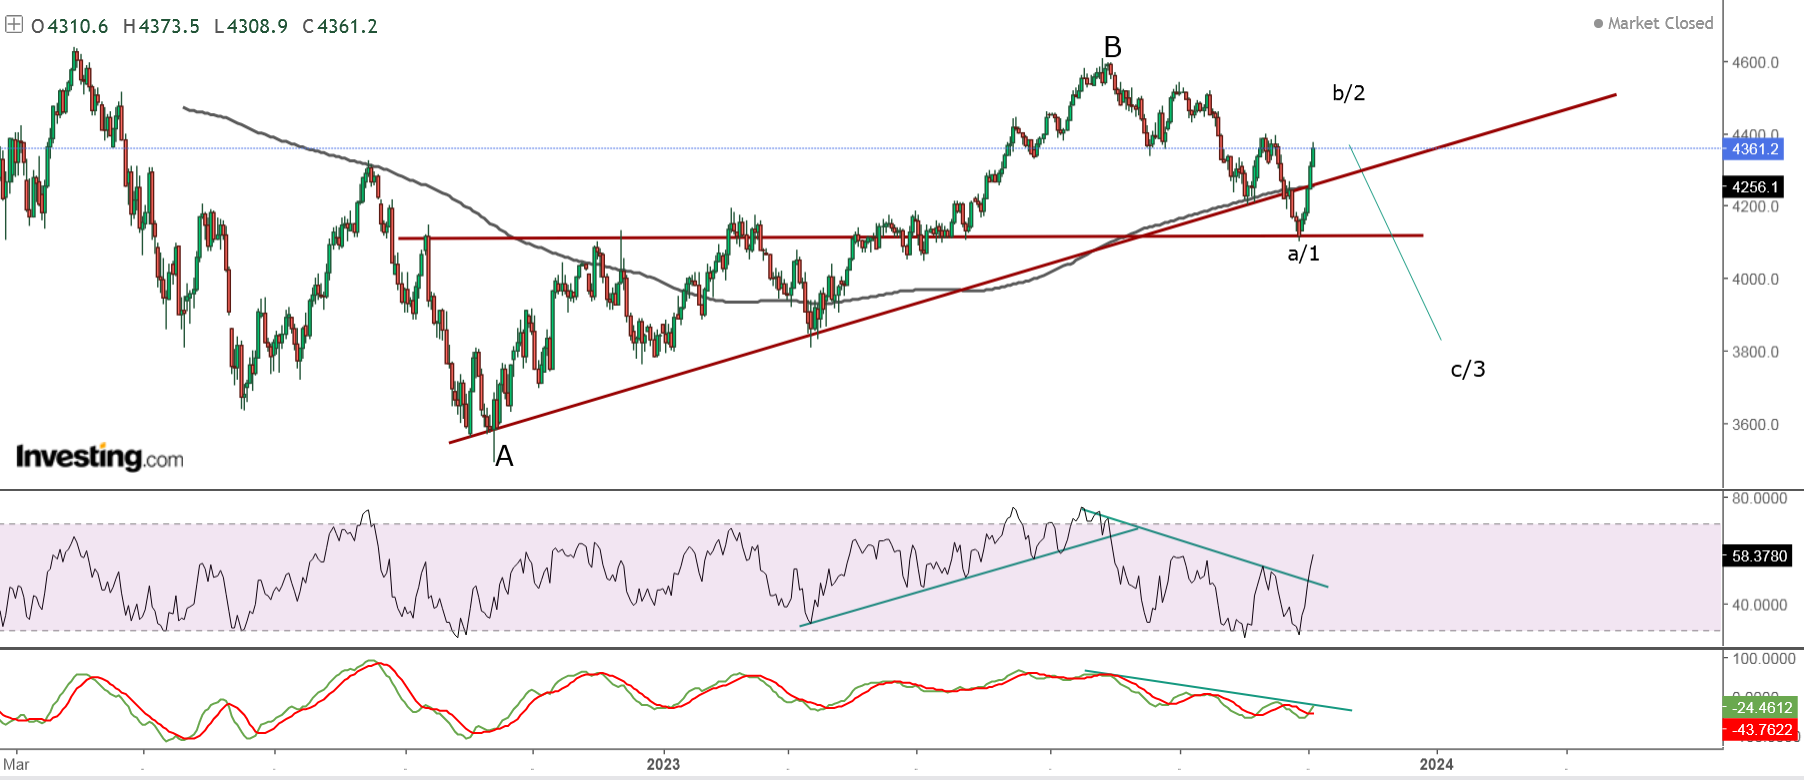
TECHNICAL PICTURE and ELLIOTT WAVES
Short term - zig-zag, more likely part of a bigger zig-zag.

Intermediate term - there is two options w2 of C(very low odds) or e-wave completing the B-wave.

Long term - 4y cycle high the end of 2021, now a-b-c lower into 4y cycle low in Q1 2024.Very long term - most likely huge double zig-zag from the 2009 low. If we are lucky this is lower degree b-wave(green) and there is one more high. If not multi year decline has started.

MARKET BREADTH INDICATORS
Market Breadth Indicators - still pointing higher, but now they have reset after oversold levels so turn lower is possible.
McClellan Oscillator - divergence.
McClellan Summation Index - buy signal.
Weekly Stochastic of the Summation Index - buy signal.
Bullish Percentage - rising.
Percent of Stocks above MA50 - touched overbought.
Advance-Decline Issues - close to overbought
Fear Indicator VIX - testing the previous low.
HURST CYCLES
Short term cycles - two scenarios decline into 5w low and last push for extended 20w cycle high or this is the 20w high with three extended 5w cycles.

Week 4 for the 20w cycle. Rising into 20w cycle high currently at week 17 discussed above.
Long term the previous 4y cycle high is repeating 3x40w cycles/two years for mid-cycle high(2018-2019 / 2022-2023) and down into 4y low.