Oct 29, 2023

Weekly preview

Lower low as expected, my target the support area has been reached, some divergences... and now it is getting complicated to forecast when to expect the bottom.
From market breadth and cycle perspective there is enough evidence to say the indices are close to a bottom. The pattern is strange it looks like impulse but it brakes the rules, w-y-z? - very rare... the usual is double zig-zag which means another 4-5 weeks.
If you look at the histogram for example the price is still accelerating lower, there is no panic to signal a low... best guess a few weeks for a bottom to be formed and higher in December. I do not know how it will look like, the next support MA200 and the trend line on the weekly chart another 150 points lower


TRADING
Trading trigger - sell signal.
Analysis - the indices turned lower to complete the 4y cycle low. Intermediate term - nearing a low, in a few weeks.
P.S. - for a trade both analysis and trigger should point in the same direction.


TECHNICAL PICTURE and ELLIOTT WAVES
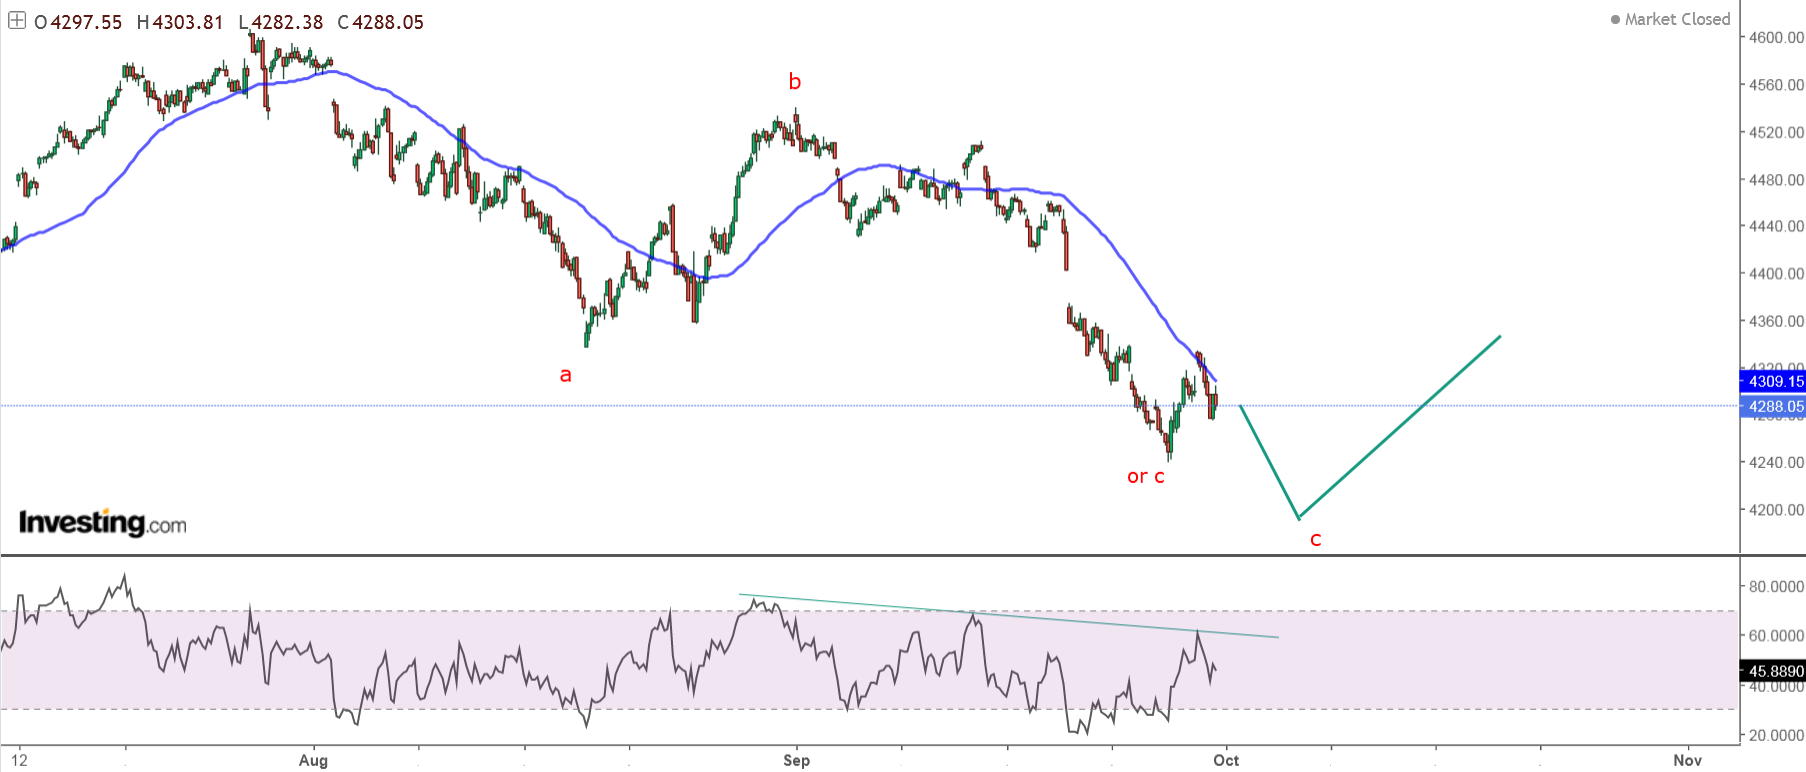
Short term - w-y-z alternate one more up and down for double zig-zag.


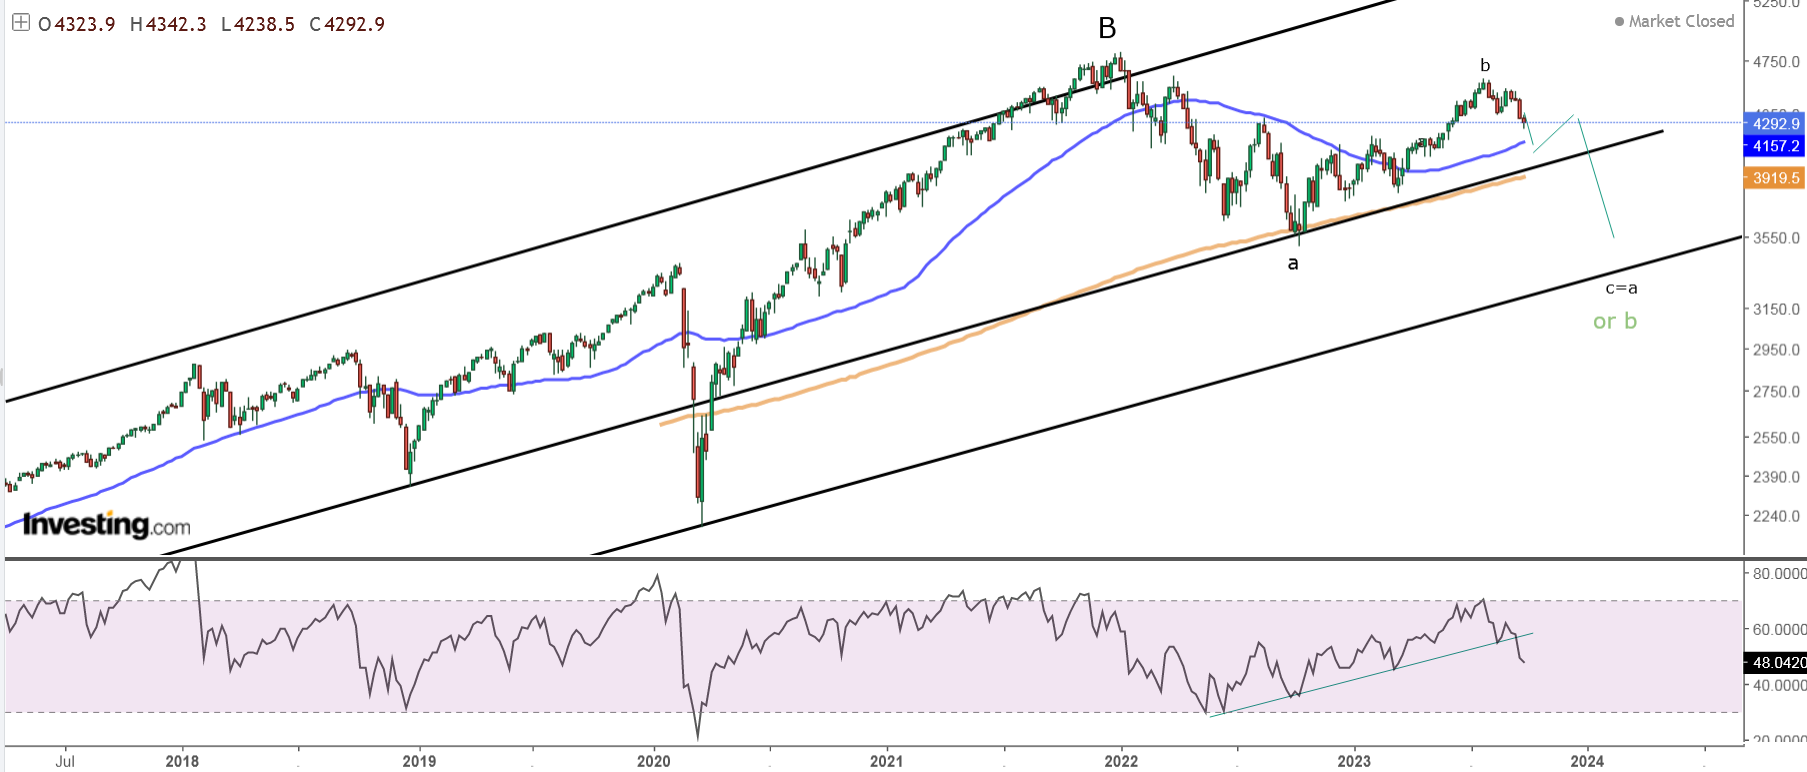
Intermediate term - lower low and the support area hit. There is a potential for a bottom, but no signs for reversal. There is one more target lower MA200 and the trend line on the weekly chart - see below.


Long term - 4y cycle high the end of 2021, now a-b-c lower into 4y cycle low in Q1 2024.
Very long term - most likely huge double zig-zag from the 2009 low. If we are lucky this is lower degree b-wave(green) and there is one more high. If not multi year decline has started.


MARKET BREADTH INDICATORS
Market Breadth Indicators - oversold and some divergences.
McClellan Oscillator - multiple divergences.
McClellan Summation Index - sell signal, oversold.
Weekly Stochastic of the Summation Index - neutral.
Bullish Percentage - oversold .
Percent of Stocks above MA50 - oversold, divergence.
Advance-Decline Issue - slightly oversold levels.
Fear Indicator VIX - grinding higher.


HURST CYCLES
Short term cycles - no clear 10w low, it looks like we have three longer 5w cycles. Maybe 20d low and higher next week....


Week 16 for the 20w cycle. The indices should be near to a 20w cycle low.

Oct 14, 2023

Weekly preview

What we have:
- from pattern perspective depends on which index you are looking at NDX is strong the decline looks corrective or RUT/NYSE weaker looks more like impulse with w5 just started.
- from cycle perspective 2.5 half months(11 weeks) from the last high. I can say the decline is over and moving higher into 20w high or this is 10w high and next is 10w low which means one more lower low to complete 20w low.
So tricky - my opinion is we will see one more low and higher for the rest of the year. I waited to see how the week ends and most of the gains were retraced so no strong weekly candle to suggest reversal.


TRADING
Trading trigger - buy signal.
Analysis - the indices turned lower to complete the 4y cycle low. Intermediate term not clear, I think we will see one more low.
P.S. - for a trade both analysis and trigger should point in the same direction.


TECHNICAL PICTURE and ELLIOTT WAVES
Short term - we have double zig-zag higher. It could be wave-a of bigger move higher or correction before continuing lower.


Intermediate term - a-b-c lower so far and 20w low expected. Logical targets - MA200 or slightly lower the trend lines.
I have the feeling we will see one more low.


Long term - 4y cycle high the end of 2021, now a-b-c lower into 4y cycle low in Q1 2024.
Very long term - most likely huge double zig-zag from the 2009 low. If we are lucky this is lower degree b-wave(green) and there is one more high. If not multi year decline has started.


MARKET BREADTH INDICATORS
Market Breadth Indicators - either we have reversal or preparing for divergence.
McClellan Oscillator - around zero.
McClellan Summation Index - neutral.
Weekly Stochastic of the Summation Index - neutral.
Bullish Percentage - turned higher.
Percent of Stocks above MA50 - turned higher.
Advance-Decline Issues - in the middle of the range.
Fear Indicator VIX - up and down.


HURST CYCLES
Short term cycles - 20d high and next week we should see 20d low. Possible 10w/20w/40w cycles are shown.


Week 13 for the 20w cycle. Moved the 40w low to the right in this case we have one more 5w cycle for 20w low.

Oct 9, 2023

Weekly preview

There is enough to count a low - five waves for c-wave and 19 weeks for 20w low but market breadth indicators do not show signs of a bottom. There is high probability to see one more low... now waiting to see this move up.


TRADING
Trading trigger - buy signal.
Analysis - the indices turned lower to complete the 4y cycle low. Intermediate term low expected soon.
P.S. - for a trade both analysis and trigger should point in the same direction.


TECHNICAL PICTURE and ELLIOTT WAVES
Short term - the move looks like impulse c-wave or maybe third wave. It could be that b/iv-wave is running and one more low will follow... so waiting and watching.


Intermediate term - a-b-c lower and 20w low expected. Logical targets - MA200 or slightly lower the trend lines.


Long term - 4y cycle high the end of 2021, now a-b-c lower into 4y cycle low in Q1 2024.
Very long term - most likely huge double zig-zag from the 2009 low. If we are lucky this is lower degree b-wave(green) and there is one more high. If not multi year decline has started.


MARKET BREADTH INDICATORS
Market Breadth Indicators - oversold levels, no divergences so far or signs of a bottom.
McClellan Oscillator - below zero, divergence.
McClellan Summation Index - sell signal.
Weekly Stochastic of the Summation Index - sell signal.
Bullish Percentage - almost touched oversold level.
Percent of Stocks above MA50 - oversolld level.
Advance-Decline Issues - oversolld level and reversal.
Fear Indicator VIX - weak drifting higher.


HURST CYCLES
Short term cycles - the price above the MA and the indicator breaking the trend line means high of at least 5w magnitude. Speculation on my side - three longer 5w cycles for 20w high sometimes in November. Short term higher into 20d high.


Week 19 for the 20w cycle. Waiting for a low, maybe we saw it waiting for confirmation.

Oct 1, 2023

Weekly preview

The price action this week confirms the analysis - a-b-c lower and 20w low expected. It is difficult to say if the pop higher is over usualy the begining of the month is positive, but I think we should see final move lower. If you look at the daily chart 4150 seems to be very important level - this is the logical target.


TRADING
Trading trigger - sell signal.
Analysis - the indices turned lower to complete the 4y cycle low. Intermediate term low expected in a week or two.
P.S. - for a trade both analysis and trigger should point in the same direction.


TECHNICAL PICTURE and ELLIOTT WAVES
Short term - this bounce could be over, or it could be sideways pattern too early to say. Alternate the whole move lower is over, but one final decline looks more likely.


Intermediate term - a-b-c lower and 20w low expected. Look at the area around 4150 it has been tested so many times and it is the cross point with the trend line - such levels attract like magnet the price.


Long term - 4y cycle high the end of 2021, now a-b-c lower into 4y cycle low in Q1 2024.
Very long term - most likely huge double zig-zag from the 2009 low. If we are lucky this is lower degree b-wave(green) and there is one more high. If not multi year decline has started.


MARKET BREADTH INDICATORS
Market Breadth Indicators - still negative, no signs of a bottoming.
McClellan Oscillator - around zero.
McClellan Summation Index - sell signal.
Weekly Stochastic of the Summation Index - sell signal.
Bullish Percentage - moving lower.
Percent of Stocks above MA50 - oversold level.
Advance-Decline Issues - pointing lower.
Fear Indicator VIX - looks like double bottom.


HURST CYCLES
Short term cycles - pop higher for 20d high which should be 10w high then final 20d low and 20w low.


Week 18 for the 20w cycle.