Aug 26, 2023

Weekly preview

It is more likely that we saw the low - another decline and NYSE/DJI/NDX will look like impulse which I have not seen for a long time.
We saw 5w high this week that is why the sharp decline... from cycle perspective it is the opposite lower low will loook better.
Probably choppy price action for 1-2 weeks and higher into 10w high.


TRADING
Trading trigger - sell signal.
Analysis - the indices turned lower to complete the 4y cycle. Intermediate term - close to a low or we saw it and the next high around the second half of September.

P.S. - for a trade both analysis and trigger should point in the same direction.


TECHNICAL PICTURE and ELLIOTT WAVES
Short term - probably a-b-c completed or w-x-y/ugly impulse... w4 retracing 62% is very unusual.


Intermediate term - Intermediate term - some kind of w-x-y/B or a-b-c/B - at the end only the labels are different. Now turned lower and most likely the C-wave is running.


Long term - most likely huge double zig-zag from the 2009 low. If we are lucky this is lower degree b-wave(green) and there is one more high. If not multi year decline has started.


MARKET BREADTH INDICATORS
Market Breadth Indicators - the same like last week just pointing lower with no signs of a low or oversold levels.
McClellan Oscillator - below zero.
McClellan Summation Index - sell signal.
Weekly Stochastic of the Summation Index - sell signal.
Bullish Percentage - moving lower, in the middle of the range.
Percent of Stocks above MA50 - pointing lower, close to oversold level.
Advance-Decline Issues - around oversold level.
Fear Indicator VIX - up and down, no fear not to mention capitulation.
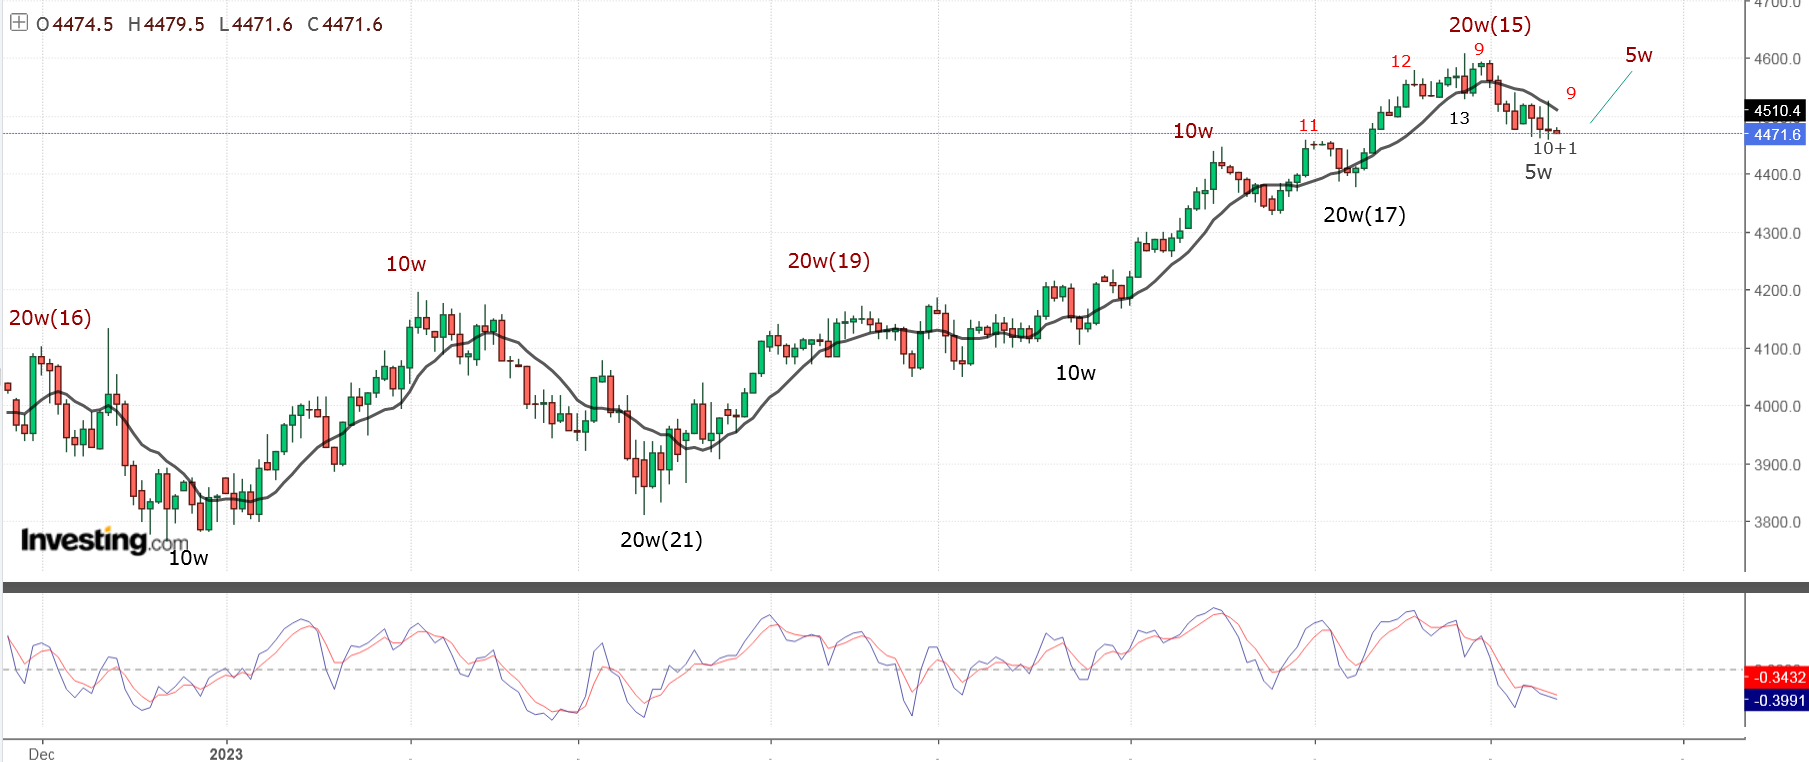

HURST CYCLES
Short term cycles - we saw 5w high this week. Expect 10w low in the next 1-2 weeks or we saw it already.


Week 7/23 for the 20w cycle. Visually I expect 18m cycle consisting of three longer 20w cycles(week 23). On the chart above I will stick to the theory and count four 20w cycles(week 7).
The highs do not have average length too. I think we have 4y cycle high consisting of 2 cycles instead of 3x18m cycles like the previous one 2018-2022 with a high in the middle.

Aug 19, 2023

Weekly preview

With the decline this week we have new information - the current move lower has comparable length and size like the one in December.2022 and February.2023. It is of the same degree which means the indices are heading lower into 10w not 5w low and from pattern perspective another higher high is less likely.

Looking the short term cycles and pattern I would say the low should be the end of next week like Thursday.


TRADING
Trading trigger - sell signal.
Analysis - the indices turned lower to complete the 4y cycle. Intermediate term - close to a low(in a week) and the next high around the end of September.

P.S. - for a trade both analysis and trigger should point in the same direction.


TECHNICAL PICTURE and ELLIOTT WAVES
Short term - looking at different indices the most likely pattern is double zig-zag. w-wave with c diagonal, x-wave running flat and now expecting b-c to complete y-wave zig-zag.
The surprise will be if we have 1-2-3 impulse... not a big believer, but who knows.


Intermediate term - some kind of w-x-y/B or a-b-c/B - at the end only the labels are different. Now turned lower and most likely the C-wave is running.


Long term - most likely huge double zig-zag from the 2009 low. If we are lucky this is lower degree b-wave(green) and there is one more high. If not multi year decline has started.


MARKET BREADTH INDICATORS
Market Breadth Indicators - one oscillator is oversold, but the others are just pointing lower with no signs of a low.
McClellan Oscillator - hit very oversold level, expecting divergence next week.
McClellan Summation Index - sell signal.
Weekly Stochastic of the Summation Index - sell signal.
Bullish Percentage - moving lower.
Percent of Stocks above MA50 - moving lower.
Fear Indicator VIX - moving higher.
Advance-Decline Issues - moving lower.


HURST CYCLES
Short term cycles - heading lower into 10w low. When the current 20d cycle is completed this should be the 10w low.


Week 22 for the 20w cycle. I think the most likely scenario is 18m cycle consisting of three longer 20w cycles. On the chart above I will try to stick to the theory and count four 20w cycles with no clear 40w low.
The highs do not have average length too. I think we have 4y cycle high consisting of 2 cycles instead of 3x18m cycles like the previous one 2018-2022 with a high in the middle.

Aug 11, 2023

Weekly preview

Very choppy price action this week so nothing really new - working on a bottom.
Because of tech stocks SPX looks weaker with possible impulse lower, but if you look at other indices the decline looks like corrective wave 4. Example with DJT it will make perfect wave iv/c/B for a huge flat from the top in late 2021, DJI the same story just not so well visible.
Looking at other assets like USD/BTC one more low/high will look great for completed pattern. The USD needs one more decline to complete a-b-c pattern and exactly the opposite for BTC one more high for v/c/B.

Short said the real decline should start after the next high, when all assets are aligned and ready for reversal. Even if we have SPX with impulse lower expect deep retracement and divergence between NDX/SPX and DJ.


TRADING
Trading trigger - sell signal.
Analysis - long term sell the rips. Intermediate term - important high completed the correction from the October low.

P.S. - for a trade both analysis and trigger should point in the same direction.


TECHNICAL PICTURE and ELLIOTT WAVES
Short term - possible impulse 1/a lower or just another w-x-y we will know more next week.


Intermediate term - some kind of w-x-y/B or a-b-c/B - at the end only the labels are different.
Probably the price will find support around MA50.


Long term - most likely huge double zig-zag from the 2009 low. If we are lucky this is lower degree b-wave(green) and there is one more high. If not multi year decline has started.


MARKET BREADTH INDICATORS
Market Breadth Indicators - pointing lower with sell signals.
McClellan Oscillator - below zero.
McClellan Summation Index - sell signal.
Weekly Stochastic of the Summation Index - sell signal.
Bullish Percentage - pointing lower, below 70.
Percent of Stocks above MA50 - pointing lower, below 75.
Fear Indicator VIX - correcting lower.
Advance-Decline Issues - pointing lower, in the middle of the range..


HURST CYCLES
Short term cycles - it looks like 5w low to me.


Week 5 for the 20w cycle? We do not have clear cycles:
- if I stick to the average length we have 10w/20w cycles shown on the chart above. In this case the next 20w cycle is running, it is around the low of the first 5w cycle with three more to go. There is no clear 40w cycle low, it happens when the cycle of higher degree is dominant - the 18m cycle.
- counting important highs/lows - in this case we have very long 20w cycles and the next low should be this or next week.
- the 4y cycle high consisting of 2 cycles instead of 3x18m cycles like the previous one.

Aug 7, 2023

Weekly preview

Bearish weekly candle, decline into 10w cycle low is running. The RSI trend line was broken decisively so the leg from the March low is over or best case one more high with divergence.
From pattern perspective mid-June was the first time with possible completed pattern and a top, last week was the second time.
In June market breadth indicators were in buy mode now they turned into sell mode.
The big question mark are cycles - they are not very clear. Two approaches are shown below - stick to average length with dominant 18m cycle and no clear 40w low and second extended cycles with 20-25 weeks length. In the first case this is the top and the leg lower has another 2-3 months to go in the second scenario it should complete soon and make one more high with divergences.


TRADING
Trading trigger - sell signal.
Analysis - long term sell the rips. Intermediate term - important high completed the correction from the October low.

P.S. - for a trade both analysis and trigger should point in the same direction.


TECHNICAL PICTURE and ELLIOTT WAVES
Short term - probably zig-zag lower, too early to forecast it... not a big believer in the impulse count.


Intermediate term - some kind of w-x-y/B or a-b-c/B - at the end only the labels are different.
The indicators are showing divergences, RSI broke the trend line so the leg from the March low is over.


Long term - most likely huge double zig-zag from the 2009 low. If we are lucky this is lower degree b-wave(green) and there is one more high. If not multi year decline has started.


MARKET BREADTH INDICATORS
Market Breadth Indicators - with sell signal.
McClellan Oscillator - below zero.
McClellan Summation Index - sell signal.
Weekly Stochastic of the Summation Index - sell signal.
Bullish Percentage - turned lower below 70.
Percent of Stocks above MA50 - turned lower below 75.
Fear Indicator VIX - spike higher.
Advance-Decline Issues - turned lower in the middle of the range.


HURST CYCLES
Short term cycles - should be close to 5w low.


Week 4 for the 20w cycle? We do not have clear cycles:
- if I stick to the average length we have 10w/20w cycles shown on the chart above. In this case the next 20w cycle is running, it is around the low of the first 5w cycle with three more to go. There is no clear 40w cycle low, it happens when the cycle of higher degree is dominant - the 18m cycle.
- counting important highs/lows - in this case we have very long 20w cycles and the next low should be in 1-2 weeks.