Sep 24, 2022

Weekly preview

The pattern looks like zig-zag lower for b/B into 20w low. Almost full retracement this means sideways pattern flat or triangle. I think a few days 2-3 are needed for 5w cycle to be completed... some kind of bottoming next week.
There is a lot of excitement look at the number of comments - this happens around tops or bottoms.
If this is wrong we should see serious plunge next week some kind of third wave - it does not feel like that.


TRADING
Trading trigger - sell signal
Analysis - long term sell the rips, we have major top. Intermediate term - sideways pattern for a while.

P.S. - for a trade both analysis and trigger should point in the same direction.


TECHNICAL PICTURE and ELLIOTT WAVES
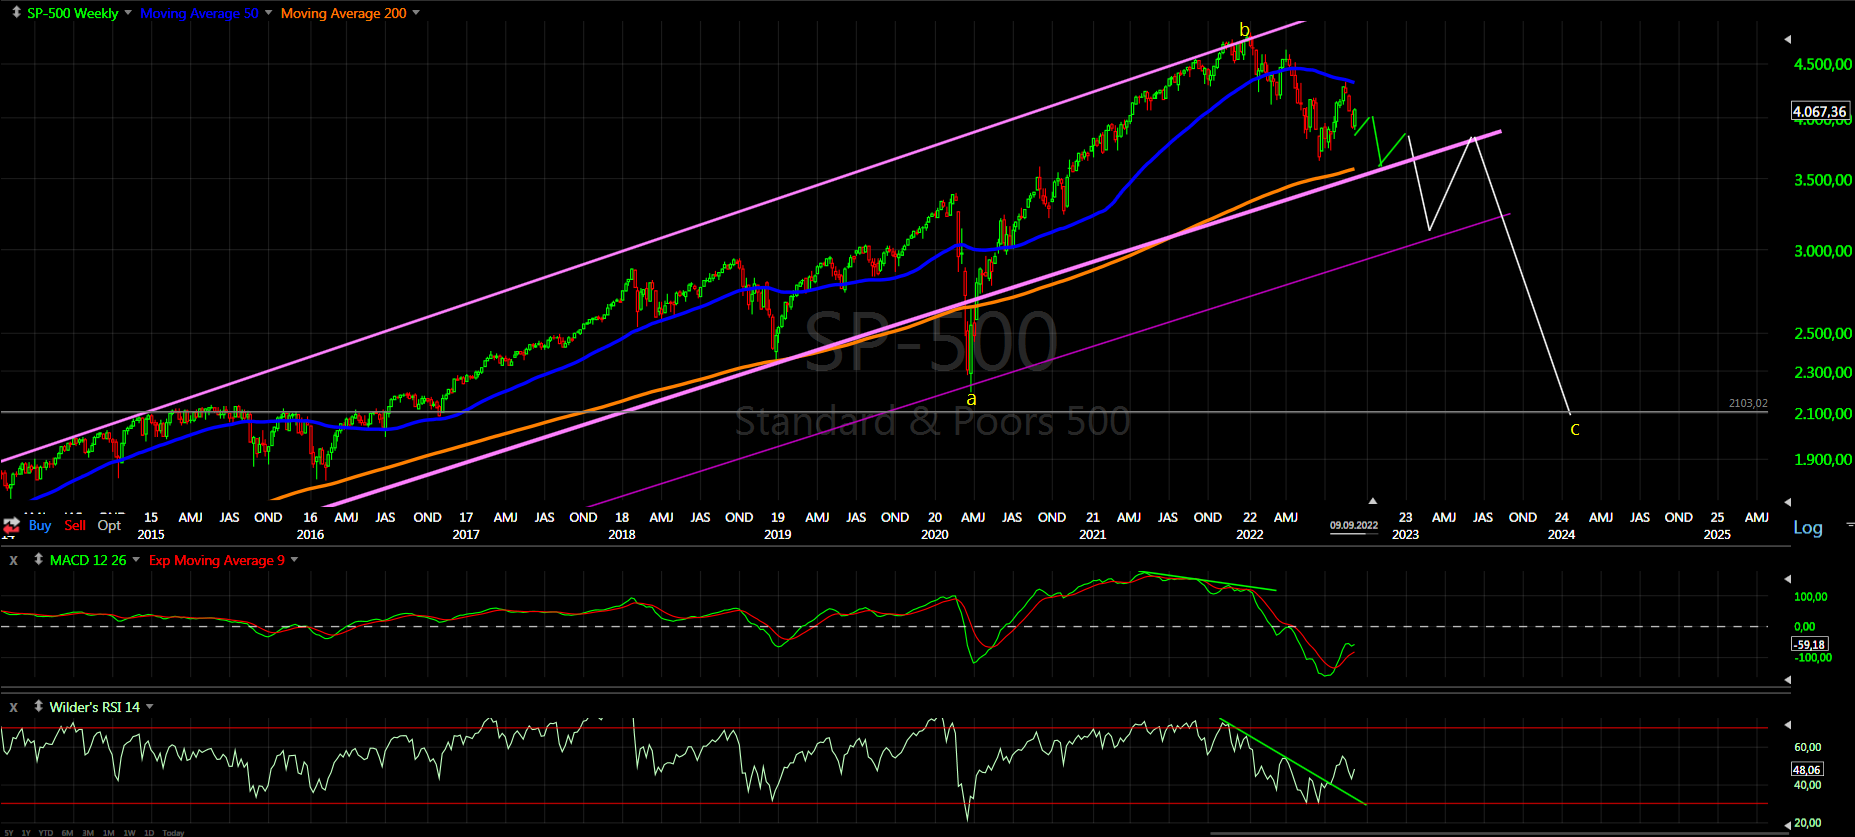
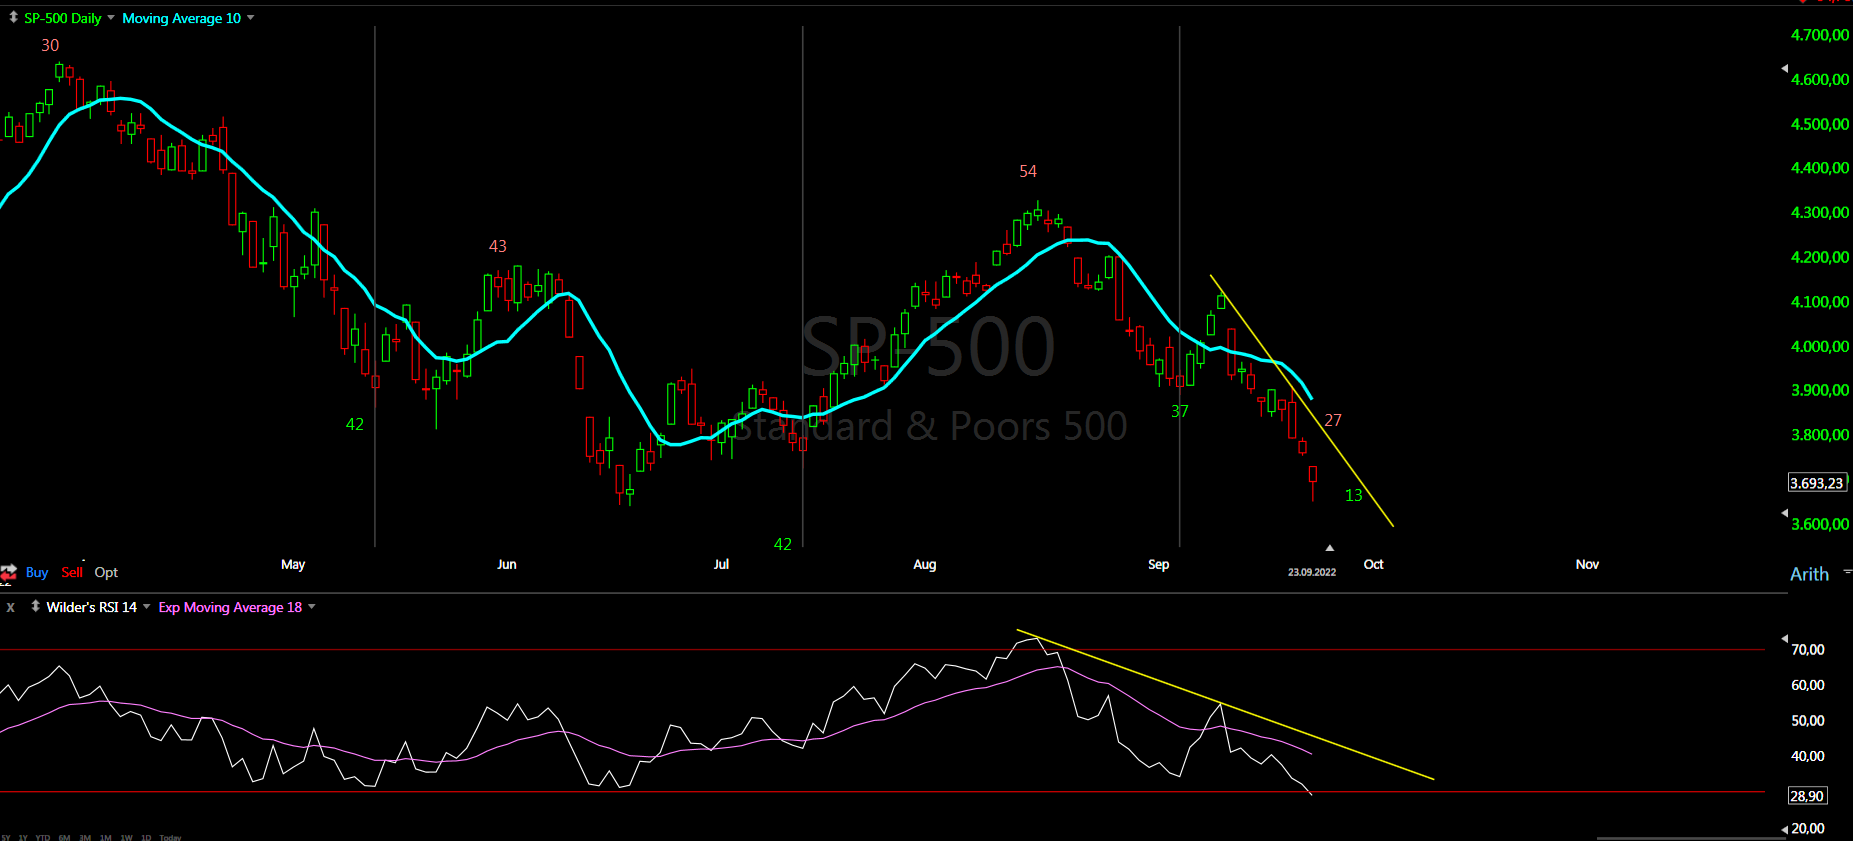
Short term - it looks like we have b/B from the June low. The alternate scenario is B(red) wave of lower degree and continuation lower.


Intermediate term - the indices are in a sideways pattern, if I am wrong the decline will just continue.
Looking the indicators like RSI, histogram it is more likely to have zig-zag than third wave.


Long term - if we are lucky this is b-wave, if not huge double zig-zag from the 2009 low was completed and it will get very ugly in the next years.


MARKET BREADTH INDICATORS
Market Breadth Indicators - most are oversold.
McClellan Oscillator - very oversold level.
McClellan Summation Index - sell signal.
Weekly Stochastic of the Summation Index - sell signal.
Bullish Percentage - very oversold level.
Percent of Stocks above MA50 - very oversold level.
Fear Indicator VIX - lower high comparedcwith the previous SP500 low.
Advance-Decline Issues - very oversold level.


HURST CYCLES
Short term cycles - probably a few days to complete 5w/20w cycle low. I think we have dominant 20w cycle and the cycles of lower degree 5w/10w can not be clearly pinpointed. It looks like 10w in the middle and two 5w cycles left and right.


Week 14 for the 20w cycle. RSI confirms we have decline into 20w low.

Sep 17, 2022

Weekly preview

"Surprising" reversal... only if you do not pay attention to cycles. This huge one day plunge changed something it is possible that we have b/B wave of higher degree from the June low not from the September low. Just waiting to see when the current decline will complete. There is enough weeks 13 to think about 20w cycle low... which makes it very likely that wave B of higher degree is running.


TRADING
Trading trigger - sell signal.
Analysis - long term sell the rips, we have major top. Intermediate term - sideways pattern for a while.

P.S. - for a trade both analysis and trigger should point in the same direction.


TECHNICAL PICTURE and ELLIOTT WAVES
Short term - waiting for the decline to complete to make some conclusions. I think when it is complete we should see c/B from the June low. The bearish option is we saw the important high and the decline is underway... so only B-waves(red) of lower degrees.


Intermediate term - the indices are in a sideways pattern, if I am wrong the decline will just continue.


Long term - if we are lucky this is b-wave, if not huge double zig-zag from the 2009 low was completed and it will get very ugly in the next years.


MARKET BREADTH INDICATORS
Market Breadth Indicators - pointing lower, but it does not feel like reversal.
McClellan Oscillator - below zero.
McClellan Summation Index - sell signal.
Weekly Stochastic of the Summation Index - sell signal.
Bullish Percentage - moving lower.
Percent of Stocks above MA50 - moving lower.
Fears Indicator VIX - testing the last top.
Advance-Decline Issues - in the middle of the range.


HURST CYCLES
Short term cycles - the indices should be at 20d low next is 20d high probably around FOMC then we should see 5w low. The surprise will be if this was 20w low only 3 months long instead of four it could happen in sideways patterns.


Week 13 for the 20w cycle. DAX if the B-wave is not complete this is perfect cycle+pattern count.

Sep 10, 2022

Weekly preview

The decline completed on time and now retracement higher running - this few weeks were the easy part to forecast.
Now I see two options - the first the decline resumes next week into 20w cycle low and second we saw 10w low which means some kind of move higher for 10w high is running - some sideways pattern flat or triangle.
I have shown this two options in the previous weekly preview - I think the signs point to sideways move for a while, I am following this scenario for weeks it is working so I will stick with it.


TRADING
Trading trigger - buy signal, RSI and MA10 are pointing to turn higher into the next daily cycle high.
Analysis - long term sell the rips, we have major top. Intermediate term - possible sideways pattern for a while.

P.S. - for a trade both analysis and trigger should point in the same direction.


TECHNICAL PICTURE and ELLIOTT WAVES
Short term - leg lower is completed and now retracement running.
Many trying to count impulse lower... difficult to see it, more likely something corrective. I see zig-zag lower and higher - this is confirmed by RSI.


Intermediate term - wave B completed and C has just started.
Either sideways pattern for a while or continuation lower.... I bet on sideways move, but can not confirm it at the moment.


Long term - if we are lucky this is b-wave, if not huge double zig-zag from the 2009 low was completed and it will get very ugly in the next years.


MARKET BREADTH INDICATORS
Market Breadth Indicators - trend following indicators with sell signal, momentum indicators turned up.
McClellan Oscillator - retracing higher after very oversold level.
McClellan Summation Index - sell signal.
Weekly Stochastic of the Summation Index - sell signal.
Bullish Percentage - turned higher.
Percent of Stocks above MA50 - turned higher.
Fear Indicator VIX - retracing lower.
Advance-Decline Issues - turned higher after oversold level was reached.


HURST CYCLES
Short term cycles - at 5w high, next is decline into 5w low. I think the important low was on first of September so we should see soon decline into 20d cycle low but bullish right translated cycle low. This means the decline into the 5w low should be part of bigger corrective pattern and not the resumption of the decline.


Week 12 for the 20w cycle.

Sep 1, 2022

Short update

On vacation this week so only quick update....
Next week we should see move higher for 5w high which is bearish three weeks lower and probably one week higher. On the other side the market should move higher into 10w high after eight weeks higher and three weeks lower which is bullish. How to satisfy both - expanded flat will fit perfect... this is a very early guess at the moment.

Cycles - this count continues to work so sticking with it.

The expanded flat and the pattern for the C-wave projected from it.