Trading trigger - buy signal, RSI and MA10 are pointing to turn higher into the next daily cycle high.
Analysis - long term sell the rips, we have major top. Intermediate term - possible sideways pattern for a while.
P.S. - for a trade both analysis and trigger should point in the same direction.

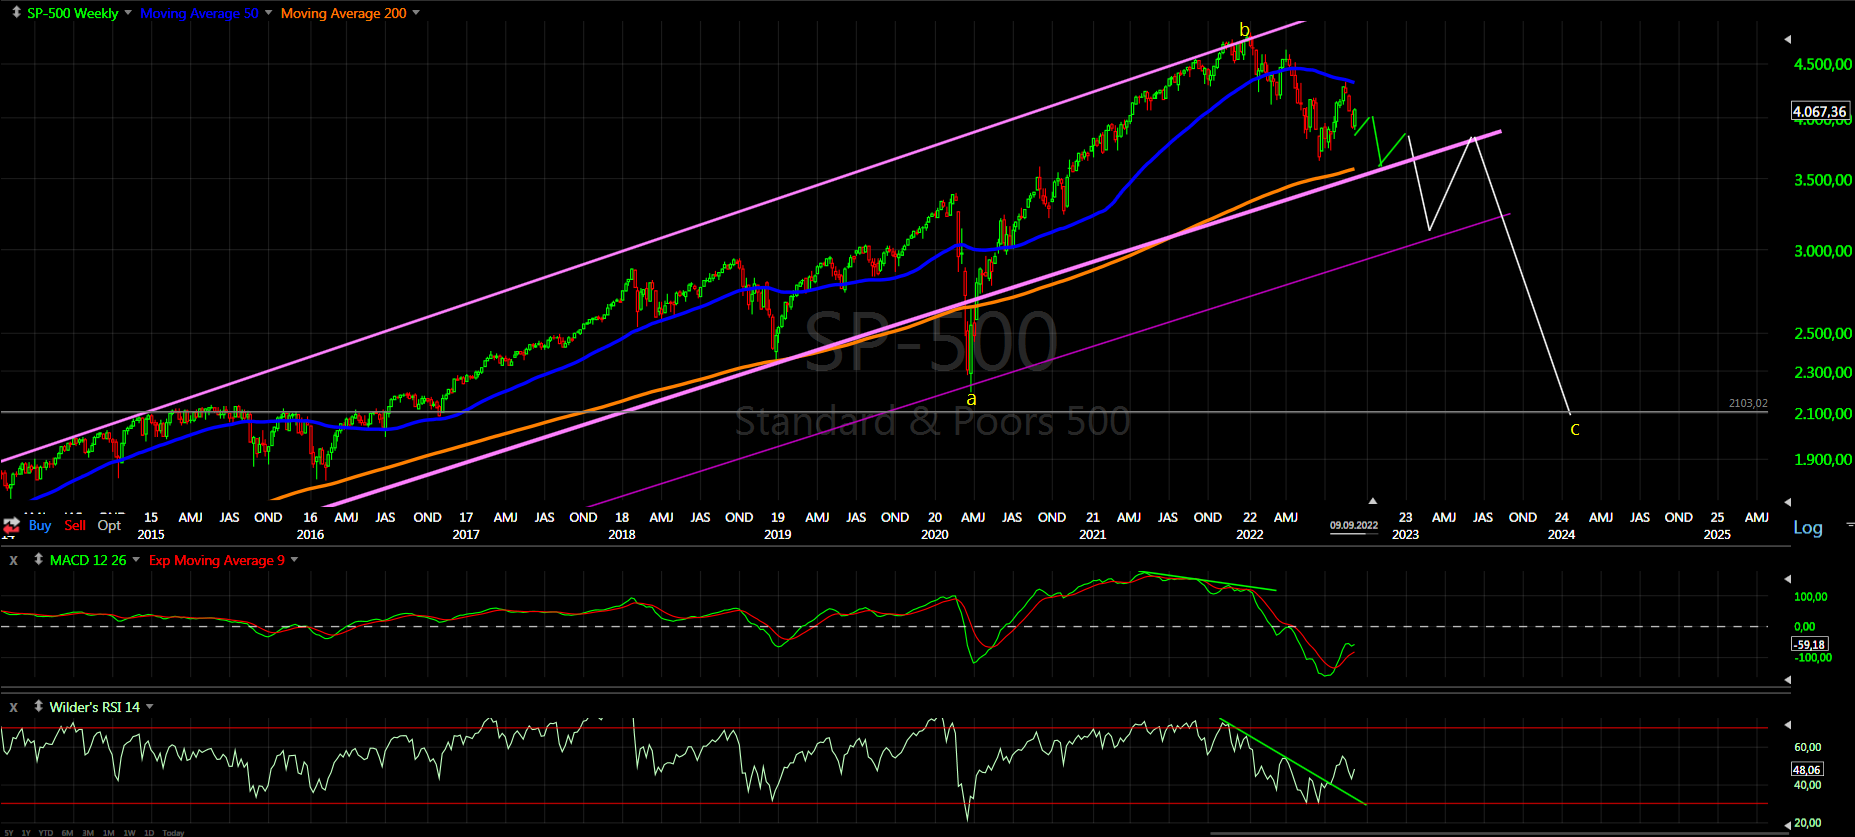
TECHNICAL PICTURE and ELLIOTT WAVES
Short term - leg lower is completed and now retracement running. Many trying to count impulse lower... difficult to see it, more likely something corrective. I see zig-zag lower and higher - this is confirmed by RSI.

Intermediate term - wave B completed and C has just started. Either sideways pattern for a while or continuation lower.... I bet on sideways move, but can not confirm it at the moment.

Long term - if we are lucky this is b-wave, if not huge double zig-zag from the 2009 low was completed and it will get very ugly in the next years.
MARKET BREADTH INDICATORS
Market Breadth Indicators - trend following indicators with sell signal, momentum indicators turned up.
McClellan Oscillator - retracing higher after very oversold level.
McClellan Summation Index - sell signal.
Weekly Stochastic of the Summation Index - sell signal.
Bullish Percentage - turned higher.
Percent of Stocks above MA50 - turned higher.
Fear Indicator VIX - retracing lower.
Advance-Decline Issues - turned higher after oversold level was reached.
HURST CYCLES
Short term cycles - at 5w high, next is decline into 5w low. I think the important low was on first of September so we should see soon decline into 20d cycle low but bullish right translated cycle low. This means the decline into the 5w low should be part of bigger corrective pattern and not the resumption of the decline.

Week 12 for the 20w cycle.


Thanks, yes the abc is quite clear. Maybe C finishes with cpi Tuesday
ReplyDeleteDAX has good looking pattern... again because of bearish 5w high I expect some sideways pattern.
ReplyDeletehttps://tvc-invdn-com.investing.com/data/tvc_b9c28776172365fb9e4ed3e3a4be0f83.png
To deep retracement (B) for zig-zag so B should be flat or triangle.
ReplyDeleteYes but I think you're seeing this move down as a B - it feels like a C. So, if it's a C my theory is this - do you think it's at all possible? It would fit with your DAX count better than a move up from here straight away. https://tvc-invdn-com.investing.com/data/tvc_f494434818d1cf9a2552d3efc7af5b64.png
ReplyDeleteWe are talking about different things - yes with the price action yesterday it is very likely that we are seeing b/B.
DeleteIf we see lower low to complete b/B the retracement will be too deep for a zig-zag B as you show it on the chart it must be flat or triangle.
Ok thank you, that's clear.
DeleteDAX the 40w cycle is very stretched, but this pattern and cycles fit just perfect - https://invst.ly/yz95-
ReplyDeleteI see a triangle
DeleteFrom January
DeleteKrasi, could you please provide either an explanation of your reference to leg "b/B" in your comments above, or point to which chart you are referring? I am having a difficult time discerning the wave degree(s) you are referring to, especially since usually legs a/A, c/C, e/E are moving in the direction of the larger degree trend. Thanks much.
ReplyDeleteTriangle looks invalid at this point - so maybe this? Krasi should let us know in the update. https://invst.ly/yzu0e
DeleteIt is shown on the daily chart in the new post.
Delete