Feb 26, 2022

Weekly preview

The war scare caused a lower low. The pattern changed some what, but not the overall picture.
From cycle perspective it makes more sense if the 18m low was in July and now we are 5w cycle away from 40w low. I do not think we have another 3 months lower. Market breadth is getting oversold and it is more likely that the indices are nearing intermediate term low than just starting lower for another 3 months.

Overall it confirms my suspicion from the last two weeks that we saw the high in November. Currently I think we should see higher for a week to complete at least 10w high and one more low for 40w low.


TRADING
Trading trigger - buy signal, in a few days we should see a high.
Analysis - long term sell the rips, I think we have major top which will be tested one more time. Intermediate term - expecting a low in a few weeks and higher for 2-3 months.

P.S. - for a trade both analysis and trigger should point in the same direction.


TECHNICAL PICTURE and ELLIOTT WAVES
Short term - I think the top is behind us, but the pattern is not more clear. According to the cycles there should be one more low to mark the end of this decline and intermediate term low. The question is if we saw B or not.


Intermediate term - I see W-x-Y(yellow) with complex double zig-zag for Y=W, alternate we have Z-wave(red).
The price have problems to move above MA50/MA200 and the middle trend line has been broken - probably the lower trend line will be tested. Waiting for another week to see where to put the b-wave.


Long term - topping process running for months and maturing. Some kind of corrective wave b-wave and c-wave will follow.


MARKET BREADTH INDICATORS
Market Breadth Indicators - I have the impression that the indices are nearing intermediate term low.
McClellan Oscillator - around zero and divergence.
McClellan Summation Index - sell signal, in very oversold teritory.
Weekly Stochastic of the Summation Index - sell signal, reached oversold level.
Bullish Percentage - heading lower.
Percent of Stocks above MA50 - touched oversold level and turned up.
Fear Indicator VIX - looks like double top.
Advance-Decline Issues - preparing for divergence.
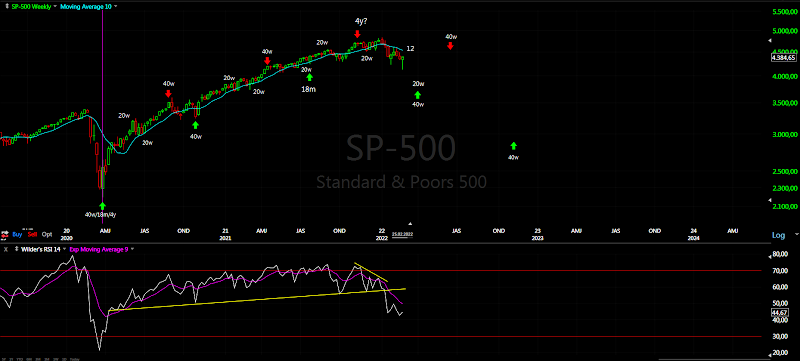

HURST CYCLES
Short term cycles - it looks like we have the expected 5w low and heading higher in 5w/10w high.


Week 12 for the 20w cycle(for the case with 18 low in July).
Long term the indices are at 4 year cycle high. The 18m low either late September with one extra 20w cycle or alternate on time in June/July... waiting to see how the pattern will play out to confirm one of the two options.
With the current price action it makes more sense if the 18m low was in July and now heading into 40w low. I expect highs echo from 2018.
Another try to combine pattern and cycles and make sense of the mess this time NYSE

Feb 19, 2022

Weekly preview

Two or three weeks are left before we see 20w cycle high. Time is passing and the price is not heading higher so time is confirming so far my suspicion from last week that the top is in.

Short term why I think there is more to the upside - first the cycle is not completed and second the decline takes more time than the move up which means there is no reversal and the indices are still in the same pattern which started in late January.


TRADING
Trading trigger - sell signal, but there should be one more up to complete this intermediate term high. Time is running out, very weak cycle higher with 3/4 of the time reached and price is still below MA10.
Analysis - long term sell the rips, close to major top. Close to intermediate term top too.

P.S. - for a trade both analysis and trigger should point in the same direction.


TECHNICAL PICTURE and ELLIOTT WAVES
Short term - primary scenario in a B-wave from a bigger pattern which started in November.


Intermediate term - I see W-x-Y(yellow) with complex double zig-zag for Y=W, alternate we have Z-wave.
MACD broke below zero and now on the way up to test the zero line.... price is struggling with MA50.


Long term - topping process running for months and maturing. Some kind of corrective wave b-wave and c-wave will follow.


MARKET BREADTH INDICATORS
Market Breadth Indicators - nothing new...
McClellan Oscillator - oscillating around zero.
McClellan Summation Index - sell signal.
Weekly Stochastic of the Summation Index - sell signal, reached oversold level.
Bullish Percentage - in the middle of the range.
Percent of Stocks above MA50 - turned lower.
Fear Indicator VIX - correction higher, one more leg lower expected.
Advance-Decline Issues - in the middle of the range.


HURST CYCLES
Short term cycles - it looks like the indices are heading lower into 5w low after the 5w high. In this case next week should be lower then final push higher for 10w/20w high. Alternate the indices rally from next week into the expected high.


Week 3 for the 20w cycle. The 20w cycle high at week 15 so close to a high expected in the next 1-3 weeks.
Long term the indices are at 4 year cycle high. The 18m low either late September with one extra 20w cycle or alternate on time in June/July... waiting to see how the pattern will play out to confirm one of the two options.
An example how cycles and pattern look like if the 18m low was on time in July using the DAX works for NYSE and DJ , for SP500/NDX just counting the a/b-wave differently.
And 18m low in late September DAX again the only pattern I see expanding triangle as Z-wave... works for NYSE and DJ they should make new high, does not work for SP500/NDX.

Feb 12, 2022

Weekly preview

Nothing new to add sideways price action this week. According to my analysis we should see another 2 weeks higher and intermediate term high.
I took a closer look at NDX and from pattern+cycle perspective with high probabilty we saw the high - from the November high we have a-wave and now in b-wave.


TRADING
Trading trigger - sell signal, but there should be more to the upside. Overall weak cycle higher with 3/4 of the time reached and crossing below MA10.
Analysis - long term sell the rips, close to potential major top. Intermediate term higher for a few weeks. Trades depending on your time frame.

P.S. - for a trade both analysis and trigger should point in the same direction.


TECHNICAL PICTURE and ELLIOTT WAVES
Short term - no change - the bearish option is the top is in, the bullish opion c of Z is underway.


Intermediate term - I see three zig-zags with roughly the same length in time W-x-Y-x-Z or possible W-x-Y with complex double zig-zag for Y=W.
MACD broke below zero and now on the way up to test the zero line.... price is struggling with MA50.


Long term - topping process running for months and maturing. Some kind of corrective wave b-wave and c-wave will follow.


MARKET BREADTH INDICATORS
Market Breadth Indicators - heading higher after intermideate term low.
McClellan Oscillator - below zero.
McClellan Summation Index - sell signal.
Weekly Stochastic of the Summation Index - sell signal.
Bullish Percentage - in the middle of the range.
Percent of Stocks above MA50 - in the middle of the range.
Fear Indicator VIX - correction higher, one more leg lower expected.
Advance-Decline Issues - in the middle of the range after oversold level.


HURST CYCLES
Short term cycles - this looks like possible short term count. It will be confirmed if we see turn higher next week.


Week 2 for the 20w cycle.
Long term I am expecting 4 year cycle high. The 18m low either late September with one extra 20w cycle or alternate on time in June/July... waiting to see how the pattern will play out to confirm one of the two options.

Feb 5, 2022

Weekly preview

I would say we have 20w low and in a few weeks we should see 20w high. Pattern - either we saw the top or the indices are in Z-wave.


TRADING
Trading trigger - buy signal. Interesting how price and RSI hit the trend line.
Analysis - long term sell the rips, close to potential major top. Intermediate term higher for a few weeks. Trades depending on your time frame.

P.S. - for a trade both analysis and trigger should point in the same direction.


TECHNICAL PICTURE and ELLIOTT WAVES
Short term - now watching the move up.... the bearish option is the top is in, the bullish opion c of Z is underway.
Overall more of the same zig-zag lower and now higher.


Intermediate term - I see three zig-zags with roughly the same length in time W-x-Y-x-Z or possible W-x-Y with complex double zig-zag for Y=W.


Long term - topping process running for months and maturing. Some kind of corrective wave b-wave and c-wave will follow.


MARKET BREADTH INDICATORS
Market Breadth Indicators - turned higher after intermideate term low.
McClellan Oscillator - reseting after oversold level.
McClellan Summation Index - still sell signal.
Weekly Stochastic of the Summation Index - still sell signal.
Bullish Percentage - turned higher in the middle of the range.
Percent of Stocks above MA50 - turned higher in the middle of the range.
Fear Indicator VIX - turned lower.
Advance-Decline Issues - reseting after oversold level.


HURST CYCLES
Short term cycles - we have somewhere 5w high and the last fourth 5w cycle for 20w high is running. Now we should see decline into 20d low. When we see it, we can better judge where the previous 20d low(20w low) was on 24 or 27 of January.


Week 1 for the 20w cycle. The average lenght is 16-18 weeks with 17 weeks I think we have 20w low and the next 20w cycle is running.
Long term I am expecting 4 year cycle high. The 18m low either late September with one extra 20w cycle or alternate on time in June/July... waiting to see how the pattern will play out to confirm one of the two options.