Oct 31, 2020

Weekly preview

Well the market creating a lot of confusion with the decline this week... I still think we have a topping and the decline has not begun. Just maximum confusion before the top.

A lot of confusion because at first look there is many possible patterns from reversal to intermediate low and the rally resumes. My opinion is we have not seen the top and we need one more move up even if it is a lower high.


TRADING
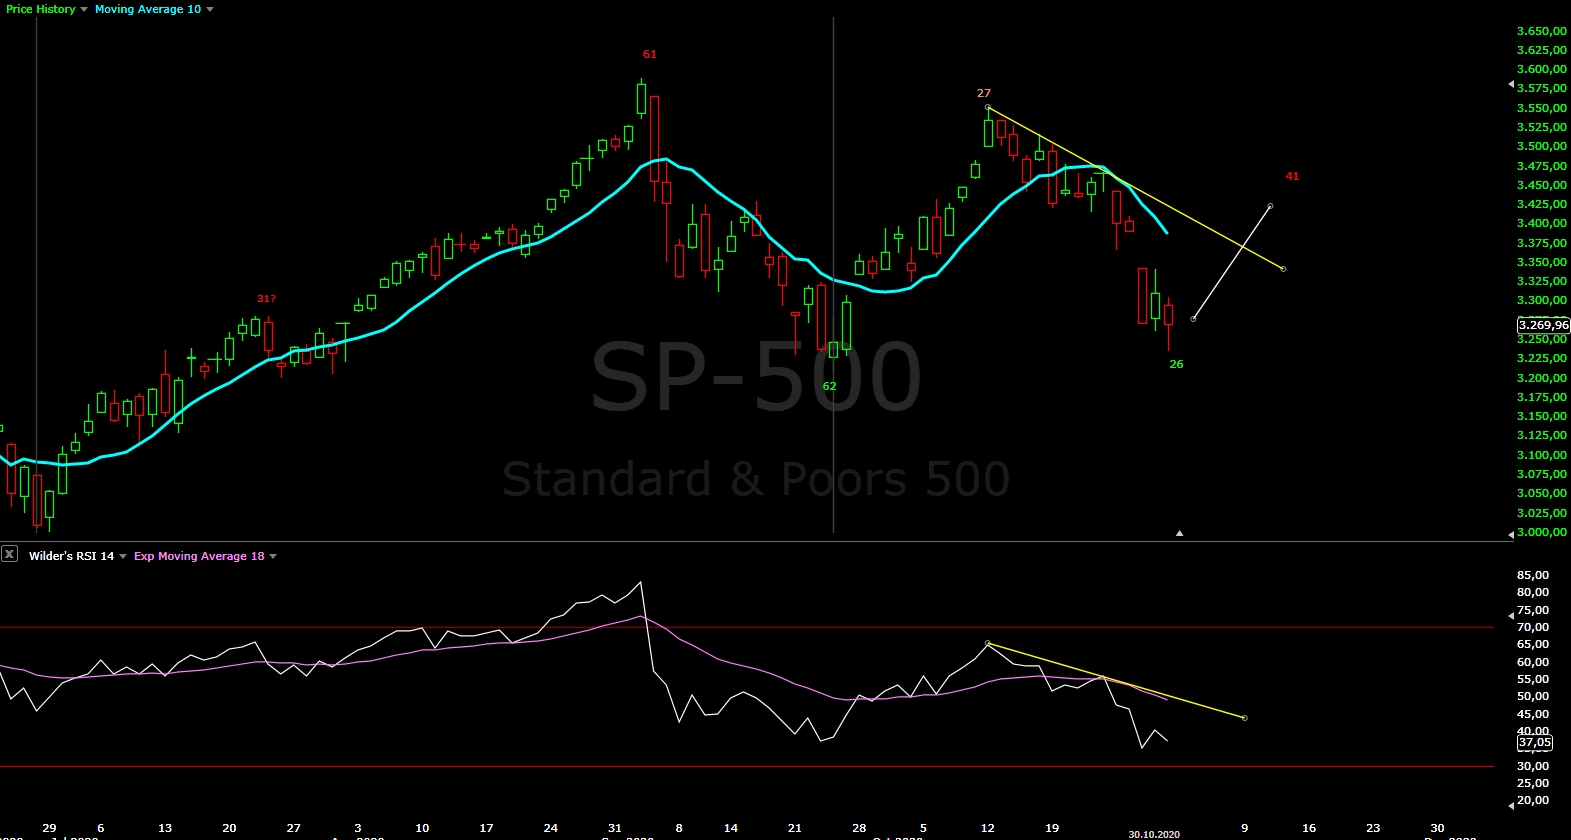
Trading cycle - sell signal. The last high and the current low are just half cycle high and low. They are not pattern high/low, they are legs of a bigger pattern. This "fake" M10 crosses occur in sideways pattern like triangle and flat and I susspect this is what is going on.


TECHNICAL PICTURE and ELLIOTT WAVES
Short term - it looks like impulse, but I think it is another corrective pattern. For impulse we need to see waves 4 and 5. NDX,RUT are not even close to something like impulse, so I doubt we will see this waves 4/5.


Intermediate term - the perfect pattern will be to see one marginal higher high. It will create maximum confusion, it will trap both bears(now convinced in reversal and giving up at higher high) and bulls(the market always going up) and it will fit perfect with cycles. So main scenario flat for g diametric or Z, alternate weak bounce to complete triangle Y or g with lower high.

The leg lower is longer than the previous leg up without fully retracing it. This is not how reversals look like.... despite that what else could it be:
The bullish view is this is a flat from the September high - there is no impulse so far for c, the b wave is the shortest which is not allowed, completes at 5w low, in the middle of nowhere concerning time.
The most bearish view - impulse lower since the September high.... I will not even comment this nonsense - just look at NDX and RUT great start of the third wave.
Another lower high for g diametric or Y triangle - possible, but it will be a weak move higher and not create enough euphoria to trap the bulls.


Long term - the bull market completed in 2018. Since then a bunch of corrective waves. Currently I think this rally should be a corrective wave of a bigger pattern most likely triangle. Look at NDX we have corrective wave which is 1,618 bigger than the previous one which could be only b of a triangle. I think the best looking pattern is Neely's triangle. Wave C should begin soon.


MARKET BREADTH INDICATORS
Market Breadth Indicators - turned lower some with oversold levels so something higher is comming at least short term bottom.
McClellan Oscillator - oversold levels.
McClellan Summation Index - sell signal.
Weekly Stochastic of the Summation Index - trying to turn lower.
Bullish Percentage - sell signal.
Percent of Stocks above MA50 - almost reached 25 level.
Fear Indicator VIX - should pullback lower for another higher low.
Advance-Decline Issues - some retracement higher expected.


HURST CYCLES
Short term cycles - it looks like 5w low so next we should see move higher for 5w high. Interesting is the last two 5w cycles high and low are asymmetrical and look similar - 10-18 days for a high and 16-9 days for a low.


Week 5 for the 20 week cycle. For now sticking to the plan that late September was 20w low and we have not seen the 40w high.

Oct 24, 2020

Weekly preview

Another choppy week... nothing really changed. I expect final push higher next week followed by sharp decline. The move up should last until mid next week, but it could be stretched a few more days until the elections.
I have synchronized the cycle count with the expected EW pattern so late September as 20 week low is the primary count.


TRADING
Trading cycle - sell signal. After the big red candle we do not have follow through for 4 days so probably fake brake lower and one more push higher before the reversal lower. High to high count is at day 36 so right on schedule - a few days higher and daily cycle high.


TECHNICAL PICTURE and ELLIOTT WAVES
Short term - continue to mimic the whole rally from March. Big sideways move and we should have reversal, but only corrective crap - exactly like September.
The orthodox EW guys trying to count second diagonal or ED/expanding ED for the big move... I am skeptical about all this diagonals.


Intermediate term - corrective decline to test MA50. I expect bounce and collapse lower.
The least wrong orthodox EW pattern is a-b-c(white) with C expanding ending diagonal(suggested by Peter Temple). At least you do not count corrective waves as impulses. It is still wrong and diametric is the right one, but it does not matter because the outcome will be the same.


Long term - the bull market completed in 2018. Since then a bunch of corrective waves. Currently I think this rally should be a corrective wave of a bigger pattern most likely triangle. Look at NDX we have corrective wave which is 1,618 bigger than the previous one which could be only b of a triangle. I think the best looking pattern is Neely's triangle. Wave C should begin soon.
The indicators with divergences ripe for reversal.


MARKET BREADTH INDICATORS
Market Breadth Indicators - with double divergences and trying to turn lower. Probably one final up short term and divergence next week.
McClellan Oscillator - reset below zero and now divergence is expected.
McClellan Summation Index - double divergence, trying to turn lower.
Weekly Stochastic of the Summation Index - buy signal.
Bullish Percentage - double divergence, trying to turn lower.
Percent of Stocks above MA50 - double divergence, trying to turn lower.
Fear Indicator VIX - consolidating and making higher lows.
Advance-Decline Issues - weak in the middle of the range, probably one final divergence next week.


HURST CYCLES
Short term cycles - final push next week for 10w/40w high. For time symmetry three more days 10+10=8+12, but it could stretch a few more days because of the elections.
We had 20d low this week a little bit too long, but too short for 5w low... somewhere in the middle - the explanation is below, I expect longer than the usual 40w cycle.


Week 4 for the 20w cycle. I have adjusted the cycles to the pattern I expect. The 40w cycle is dominant and we should see nice symmetrical bell shape for this cycle. What could be the explanation for longer cycle? - the previous one was extremely short with only 3 trading cycles and this one will be longer with 5 trading cycles so average again 8=5+3. The cycles will be adjusted for the missing time and will continue with their usual pace.


I was trying to remember, where I saw this shape above - it is the summation of three cycles idealized shape. On the chart above this three cycles are the 10w,20w and 40w cycles. This is a screenshot from one of David Hickson's videos. It is exactly the same - we have the left side and the two heads, now only the right shoulder is missing.

Oct 17, 2020

Weekly preview

Short squeeze and exhaustion on Monday, overall choppy week. I have discussed cycles and patterns in comments one more time my thoughts:
Pattern - the triangle is dead, many indices made higher high so it is more likely this is the top of the pattern and not early September. I can not not explain the move from the March low with classical EW pattern the only one fitting is neowave diametric.
Cycles - the 5w high is where it should be and we need one more 20d cycle high to complete 10w and very likely 40w high.
TA - and if you do not trust or care about "complex theories" like EW/neowaves/cycles just look at RSI and A/D issues - the trend line connecting the lows has been broken and now tested - this are very very reliable signals. It is game over the move from the March low is completing.

To summarize - 4-6 trading days higher to complete 4x20d/10w/40w cycle high, which will be most likely the top of wave B of a triangle as a diametric pattern then wave C to begin with target below the March low.

G.Neely(EW, more precisely neowave) and D.Hickson(cycles) have new videos, you can watch them on youtube if you are interested. The interesting points - Neely sees the March rally completing and wave C of a triangle for 3-4 months lower below the March low, D.Hickson and other guys commented that the September low could be 20w low.
About the pattern I agree I am following corrective pattern from the beginning. I was wondering how will wave C look like(it should be fast) when we have 40w low early December(too short only 2 months) and 18m low mid 2021(too long like 10 months). If you merge the two analysis and assume 20w low late September than we have the expected 3-4 months lower for wave C and 40w low - interesting. Such long 20w cycle is very weird, but since 2018 all moves are very weird. At the March low I made the mistake to stick to the cycle nominal model so I suggest to be open minded this time.


TRADING
Trading cycle - buy signal, MA10 was tested again(the futures did not broke the trend line). I think we have one 20d cycle which is right translated and the next one should make higher high and fail as left translated.
If you see the price breaking below MA10 run for the hills:)


TECHNICAL PICTURE and ELLIOTT WAVES
Short term.... this move up in October is exactly the same story like the whole rally from the March low - it is corrective, the majority has no clue how to count it so it is impulse what else should be:) Best match w-x-y, but it does not count so well and if we see higher high it will look better again as diametric.


Intermediate term - triangle was my last hope for classical EW pattern from the March low. With the price action this week I think neowave diametric fits much better. With orthodox EW we have the top in early September. The biggest decline was in September, which means we have reversal and this rally is not supposed to be happening.... and now we have to look for excuses like it is impulse just completing 5/5, LD and deep retracement or flat/expanded flat.
Many indices made higher highs, if SP500 follows instead of looking for excuses it is better to accept it for what it is. What is the point of just pasting labels somewhere and looking for excuses?
Again if you are not interested in theoretical discussion just look at market breadth/MACD with double divergences and RSI on the daily and weekly chart - this is all you need to know:)


Long term - the bull market completed in 2018. Since then a bunch of corrective waves. Currently I think this rally should be a corrective wave of a bigger pattern most likely triangle. Look at NDX we have corrective wave which is 1,618 bigger than the previous one which could be only b of a triangle.
I think the best looking pattern is Neely's triangle. Wave C should begin soon - white if September is 20w low and alternate yellow if late November/early December is 40w low.


MARKET BREADTH INDICATORS
Market Breadth Indicators - are positive, but we have many indicators with double divergences forming. Do not expect some lasting strength we have topping process.
McClellan Oscillator - around zero, one more lower high for short term diveregence?
McClellan Summation Index - buy signal with possible double divergence.
Weekly Stochastic of the Summation Index - buy signal.
Bullish Percentage - around 70 with possible double divergence.
Percent of Stocks above MA50 - around 75 with possible double divergence.
Fear Indicator VIX - the same consolidating sideways. Look at it from another perspective SVXY, volatility is about to explode higher - see the last chart.
Advance-Decline Issues - similar setup like RSI - testing the broken trend line and lower high.


HURST CYCLES
Short term cycles - low to low count I see 20d cycle low testing MA10. It is right translated so the next one should make higher high
High to high count - the 5w is where it should be. I expect one more high for 4x20d cycles to complete the 10w/40w cycle. Judging by the previous three 20d cycle we should see another 4-6 trading days higher and major top.


Week 14 for the 20w cycle. Another option is the September low is 20w low this is what fits with the pattern I favor.
I think this is the top of the pattern from March, which means this should be the 40w high.


SVXY huge pennant/triangle so that MA200 can catch up with price. What do you think will happen with volatility, when the pattern is completed?

Oct 10, 2020

Weekly preview

This 5w cycle high continued unusually long, but the move is still corrective and now long and big enough for a bigger sideways triangle than the one I was expecting last week - I think the whole Y wave is a triangle. Now we wait and see if a decline for about 2 weeks will follow or not to complete 5w cycle low.
Do not get fooled the market is topping with some complex pattern, but this is a top not continuation. From March we have complex corrective leg, which is typical for a triangle - I am starting to like the Neely's triangle more and more.


TRADING
Trading cycle - buy signal, the trend line was tested one more time. Not a big surprise the 4th daily cycle was expected.


TECHNICAL PICTURE and ELLIOTT WAVES
Short term - I see corrective moves.... I do not buy this reversal with LD or impulse higher. Wedging again and another double zig-zag so we have moves, which are part of bigger corrective pattern.
It is what it is - complex corrective pattern. The Majority try to simplify it to see something familiar impulse lower and higher.... it is not, just accept it complex corrective topping pattern.


Intermediate term - it is still speculation, but with three corrective legs and expected high in a few weeks the pattern which fits is triangle for Y.
Alternate we have A-B and C lower should follow.... looking cycles and market breadth this does not look very likely.
And if you want it more exotic look at RUT it looks exacly like Neely's diametric:)


Long term - the bull market completed in 2018. Since then a bunch of corrective waves. Currently I think this rally should be a corrective wave of a bigger pattern flat/triangle or x wave. With corrective waves often you have to adjust so stay open minded.


MARKET BREADTH INDICATORS
Market Breadth Indicators - are pointing higher, not a big suprise after they were signaling to expect a bottom.
McClellan Oscillator - close to overbought level.
McClellan Summation Index - buy signal.
Weekly Stochastic of the Summation Index - buy signal.
Bullish Percentage - buy signal.
Percent of Stocks above MA50 - reached the 75 level.
Fear Indicator VIX - the same consolidating sideways.
Advance-Decline Issues - finaly testing the broken trend line.


HURST CYCLES
Short term cycles - unusually long 20d cycle... nevertheless I think this is 5w high and next 5w low should follow. Lets see what happens next week. The alternate scenario is 5w high last week and just continuing higher for 10w high...


Week 13 for the 20 week cycle. The 10w low looks confirmed, the 40w high... if we have triangle or something else as a top the cycle top should be placed where the pattern is completed.

Oct 3, 2020

Weekly preview

I was expecting 3-5 days higher for 5w high and test of MA50 - we have it.

What is next is more difficult question.
From cycle perspective we have conflicting signals - the trading cycle is in buy mode this should be the expected 4th cycle and we should see another 15-20 days higher. But from another perspective we have 4 weeks lower and one week higher for 5w high(which is bearish) and next we should see decline for 3-4 weeks into 5w low this is what comes after 5w high.
From pattern perspective the bears see LD and now a-b/B or 2, the bulls see a-b-c finished and new highs coming.
I would say expect something different - most likely some sideways pattern like triangle. This can resolve this cycle conflicting signals or the other option just continuation lower.


TRADING
Trading cycle - buy signal. We have a trend line already tested on Friday. This is the 4th cycle running and we should see another 15-20 days higher(the red count high-to-high). The problem is this is the final cycle for the 40w sequence, which should be the weakest one. Probably the most profitable part of it are already behind us with the rally from Fridays last week and this week.


TECHNICAL PICTURE and ELLIOTT WAVES
Short term - the "bullish scenario" the white count is what the majority follows A/1 LD and a-b/B or 2 running.
I think something else is going on. I do not believe in LDs and I expect the decline for b to take longer into 20d low and retrace more than 62%(the yellow count). All this pat of a bigger sideways pattern.
The alternate options - continue to new highs, which is not very likely or just continue lower, which will not surprise me.


Intermediate term - the price broke below MA50 and testing it, MACD broke below the zero line and testing it. Again waiting to see what happens next before putting labels....


Long term - the bull market completed in 2018. Since then a bunch of corrective waves. Currently I think this rally should be a corrective wave of a bigger pattern flat/triangle or x wave. With corrective waves often you have to adjust so stay open minded.


MARKET BREADTH INDICATORS
Market Breadth Indicators - turned up, lets see what will follow next week.
McClellan Oscillator - reset and above zero after slightly oversold levels.
McClellan Summation Index - sell signal.
Weekly Stochastic of the Summation Index - sell signal, but reached oversold level and trying to turn up.
Bullish Percentage - turned up in the middle of the range.
Percent of Stocks above MA50 - jump from the 25 level and in the middle of the range.
Fear Indicator VIX - nothin interesting, doing nothing... it looks like bottoming.
Advance-Decline Issues - nothing interesting in the middle of the range.


HURST CYCLES
Short term cycles - we saw 4 days higher for 20d/5w high as expected. Next we should see decline into 20d low, curently 6 days old so we should see something like another 4-8 days lower.


Week 12 for the 20w cycle. At the moment my assumption is that we have 40w high and 10w low.