Feb 25, 2014
Update
SP500 moved higher so no action was needed to close longs or open shorts - the problem this rally did not erased the divergences, they are all still there.
We have another candle with long shadow which could not close at new ATH / histogram / RSI(5) / MACD hourly / McClellan Oscillator / VIX divergences. This is not a healthy rally the line in the sand is the low for the last two days - 1835.
Feb 23, 2014
Weekly review
Short term view - another push lower than reversal to the upside.
Intermediate term view - another week or two higher.
Pullback which does not look complete... overall boring week and no surprises. The forecast stays the same new ATH(the indicators have improved) and the rally should fail short after that - many indexes are lagging and the volume was bigger an rising to the downside and it is less and sinking to the upside.
Short term the indicators are pointing to another push lower - Tom Demark sell setup with price flip, topping candles with tails, histogram / RSI(5) / MACD hourly / McClellan Oscillator divergences.
Intermediate term - as long as the price stays above 1810 (support and MA50) I expect a new ATH followed by real correction 10% or more. Another push lower should not last longer than 1-2 days and we should see a green week or something is wrong and the price is probably reversing to the downside.
Trading - on Monday if the indexes start moving lower you can open shorts with stop above the last highs 1848 (or even 1843 last minor highs). Small risk, it is worth a try - if I am right small profit, but if I am wrong you will catch the reversal:)
TECHNICAL PICTURE
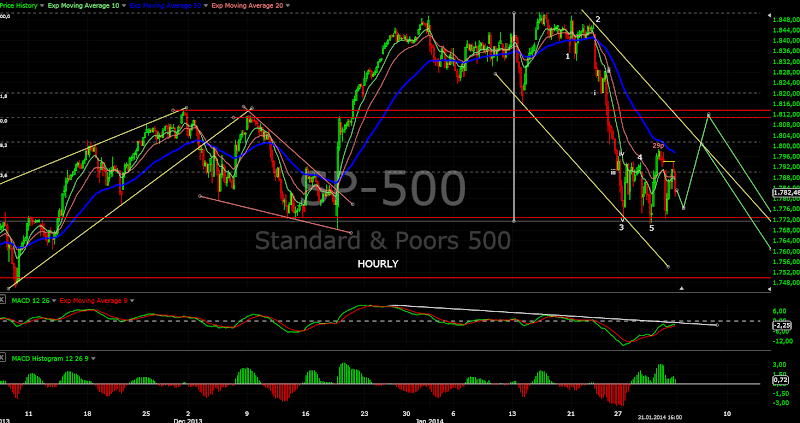
Short term - I expect another push lower Mondy-Tuesday to finish the pullback. Target is around 1810-1815 where the support is and MA50 on the daily chart.
 - Triple cross(EMA10 and EMA20 crossing EMA50) - short term trend is still up, but with double MACD divergence the pullback is probably not over.
Intermediate term - I think SP500 will make short term low at support and MA50 than we will see how high it will move...
 - Trend direction EMA50/MACD - intermediate term trend turned up.
- Momentum Histogram/RSI - momentum turned lower - the pullback is probably not over.
Long term - we had small red week so the indexes can take a breath and the next week should be green. I do not think that this move will clear the MACD divergence and the move will fail to start another long lasting rally.
 - Trend direction EMA50/MACD - the long term trend is up - the price above MA50 and MACD above zero. The MACD divergence should make you worry, that the long term trend can reverse soon.
- Momentum Histogram/RSI - momentum turned up - intermediate term trend is up.
MARKET BREADTH INDICATORS
The Market Breadth Indicators - oscillators like Advance-Decline Issues are overbought, the trend following indicators have turned up and I expect several green weeks.
McClellan Oscillator - hit mildly overbought levels and showing divergence - pullback?
McClellan Summation Index - buy signal, made higher high than the lat one - several green weeks.
Weekly Stochastic of the Summation Index - buy signal.
Bullish Percentage - buy signal... still lagging.
Percent of Stocks above MA50 - still bellow the previous highs.
Fear Indicator VIX - complacency again. Do not forget - these are levels where the VIX is a buy.
Advance-Decline Issues - hit extremes so I expect a pullback
HURST CYCLES
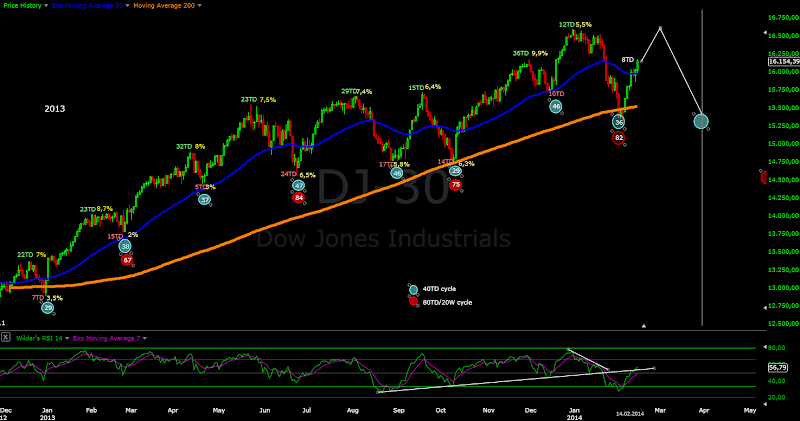
Probably the top of the smaller 20 day cycles.
 Week 3 of the next 20 week and 18 month cycle.
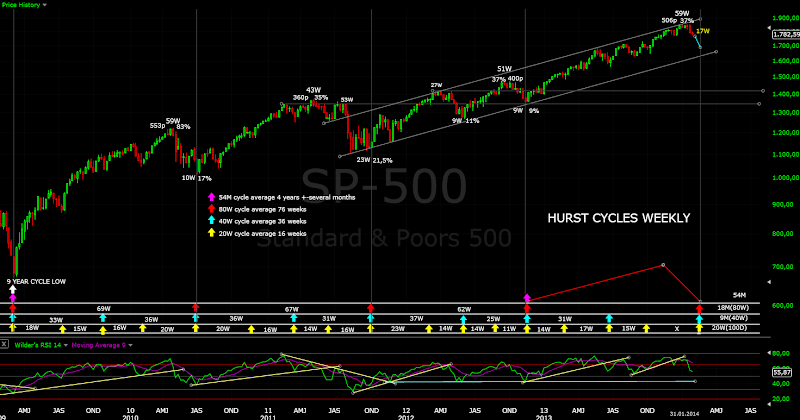
18 month cycle bottom if I am right. Usually you will see a strong rally lasting for months, but after 15 months without correction it is a little bit suspect.... The alternative is some kind of a top - double top or H&S and top of the 5 year and 9 year cycle. The line in the sand is 1740 the bottom of the last 18 month cycle if the current one moves lower this will mean the cycles of a higher degree 5 and 9 year have toped out.

Tom Demark SEQUENTIAL AND COUNTDOWN - this technique spots areas of exhaustion.
Sell setup with price flip, technical analysis says the same so I expect something to the downside. In the next 2-3 days we will know if this is a reversal or a countdown will follow.

Intermediate term view - another week or two higher.
Pullback which does not look complete... overall boring week and no surprises. The forecast stays the same new ATH(the indicators have improved) and the rally should fail short after that - many indexes are lagging and the volume was bigger an rising to the downside and it is less and sinking to the upside.
Short term the indicators are pointing to another push lower - Tom Demark sell setup with price flip, topping candles with tails, histogram / RSI(5) / MACD hourly / McClellan Oscillator divergences.
Intermediate term - as long as the price stays above 1810 (support and MA50) I expect a new ATH followed by real correction 10% or more. Another push lower should not last longer than 1-2 days and we should see a green week or something is wrong and the price is probably reversing to the downside.
Trading - on Monday if the indexes start moving lower you can open shorts with stop above the last highs 1848 (or even 1843 last minor highs). Small risk, it is worth a try - if I am right small profit, but if I am wrong you will catch the reversal:)
TECHNICAL PICTURE
Short term - I expect another push lower Mondy-Tuesday to finish the pullback. Target is around 1810-1815 where the support is and MA50 on the daily chart.

Intermediate term - I think SP500 will make short term low at support and MA50 than we will see how high it will move...

- Momentum Histogram/RSI - momentum turned lower - the pullback is probably not over.
Long term - we had small red week so the indexes can take a breath and the next week should be green. I do not think that this move will clear the MACD divergence and the move will fail to start another long lasting rally.

- Momentum Histogram/RSI - momentum turned up - intermediate term trend is up.
MARKET BREADTH INDICATORS
The Market Breadth Indicators - oscillators like Advance-Decline Issues are overbought, the trend following indicators have turned up and I expect several green weeks.
McClellan Oscillator - hit mildly overbought levels and showing divergence - pullback?
McClellan Summation Index - buy signal, made higher high than the lat one - several green weeks.
Weekly Stochastic of the Summation Index - buy signal.
Bullish Percentage - buy signal... still lagging.
Percent of Stocks above MA50 - still bellow the previous highs.
Fear Indicator VIX - complacency again. Do not forget - these are levels where the VIX is a buy.
Advance-Decline Issues - hit extremes so I expect a pullback
HURST CYCLES
Probably the top of the smaller 20 day cycles.

18 month cycle bottom if I am right. Usually you will see a strong rally lasting for months, but after 15 months without correction it is a little bit suspect.... The alternative is some kind of a top - double top or H&S and top of the 5 year and 9 year cycle. The line in the sand is 1740 the bottom of the last 18 month cycle if the current one moves lower this will mean the cycles of a higher degree 5 and 9 year have toped out.

Tom Demark SEQUENTIAL AND COUNTDOWN - this technique spots areas of exhaustion.
Sell setup with price flip, technical analysis says the same so I expect something to the downside. In the next 2-3 days we will know if this is a reversal or a countdown will follow.

Feb 16, 2014
Weekly review
Short term view - short pullback and new ATH.
Intermediate term view - 2-3 weeks more upside and than another sell off.
Just follow the market higher was the right think to do... it moved even higher than expected. Who cares about the forecast if you are on the right side:)
My advice stays the same as last week "follow the market higher". Keep it simple, you do not need to think too much. We have clear support level 1810 and MA50 on the daily chart. Start worrying if the price moves bellow that level.
Now the forecast - I think we have intermediate term bottom and 18 month cycle low and we will see at least 2-3 weeks up move before anything to the downside. My personal view this move was way too shallow as time and price, Investors Intelligence bears before the correction 14,1% after the correction 17,4% - 17% is still extreme low no fear at all too much greed. And because there were no fear I think this move will not last very long and it will make only marginal higher high and fail. Because of this reason I think, that there is no fuel for another huge rally - for now the volume confirms it (it's less than to the upside) and indicators and some indexes(RUT,DJ,XLF) are lagging.
If the forecast plays out great, but what if I am wrong? - well we stay open minded. This is 18 month cycle low and the rally will last at least 2-3 months. But we have a rally lasting more than 15 months without correction, how much higher? - full blown parabolic move and collapse as every parabola.
TECHNICAL PICTURE
Short term - if the move is so strong any pullback should find support around 1810 and after that a new ATH should follow... than we will see how the charts look like.
 - Triple cross(EMA10 and EMA20 crossing EMA50) - short term trend is up.
Intermediate term - red scenario just follow the price. In green what I think it will happen, this is just a forecast nothing more for now.
 - Trend direction EMA50/MACD - MACD moved above 0 and the price above MA50 - intermediate term trend is up.
- Momentum Histogram/RSI - momentum is up, short term trend is up.
Long term - another green candle confirmed the hammer so the price action is bullish for now and should just follow the market in the next week or two. I do not think that this move will clear the MACD divergence and the move will fail to start another long lasting rally.
 - Trend direction EMA50/MACD - the long term trend is up - the price above MA50 and MACD above zero. The MACD divergence should make you worry, that the long term trend can reverse soon.
- Momentum Histogram/RSI - momentum turned up - intermediate term trend is up.
MARKET BREADTH INDICATORS
The Market Breadth Indicators - oscillators like McClellan Oscillator a strong which is not a surprise after a vertical move, the trend following indicators are not convinced.
McClellan Oscillator - near overbought levels, probably a pullback will follow.
McClellan Summation Index - buy signal,turned up.
Weekly Stochastic of the Summation Index - still on sell, it is a lagging indicator. If my forecast is right it could not issue a buy signal at all.
Bullish Percentage - really weak for a such rally. SP500 is near to it's highs and Bullish percentage barely moved 6 points and it is far bellow the last highs.
Percent of Stocks above MA50 - moved higher after hitting mildly oversold level 25, but still bellow the previous highs.
Fear Indicator VIX - complacency everywhere again. Do not forget - these are levels where VIX is a buy.
Advance-Decline Issues - near overbought levels.
Put/Call ratio - pullback a little bit after the correction, but there is no fear still at elevated levels
HURST CYCLES
The move last week looked like a 20 week cycle bottom now we have the confirmation. 82 trading days nice cycle length. Now the next 40 day cycle is at day 8. If there will be something to the downside the 40 day cycle should start move lower early in the cycle something like day 15 to 20 an this is 2-3 weeks max to the upside.
18 month cycle bottom if I am right. Usually you will see a strong rally lasting for months, but after 15 months without correction it is a little bit suspect.... The alternative is some kind of a top - double top or H&S and top of the 5 year and 9 year cycle. The line in the sand is 1740 the bottom of the last 18 month cycle if the current one moves lower this will mean the cycles of a higher degree 5 and 9 year have toped out.

Tom Demark SEQUENTIAL AND COUNTDOWN - this technique spots areas of exhaustion.
We have price flip on the weekly chart and momentum has turned up. On the daily chart we have 6 of a sell setup and I think it will be finished.

Intermediate term view - 2-3 weeks more upside and than another sell off.
Just follow the market higher was the right think to do... it moved even higher than expected. Who cares about the forecast if you are on the right side:)
My advice stays the same as last week "follow the market higher". Keep it simple, you do not need to think too much. We have clear support level 1810 and MA50 on the daily chart. Start worrying if the price moves bellow that level.
Now the forecast - I think we have intermediate term bottom and 18 month cycle low and we will see at least 2-3 weeks up move before anything to the downside. My personal view this move was way too shallow as time and price, Investors Intelligence bears before the correction 14,1% after the correction 17,4% - 17% is still extreme low no fear at all too much greed. And because there were no fear I think this move will not last very long and it will make only marginal higher high and fail. Because of this reason I think, that there is no fuel for another huge rally - for now the volume confirms it (it's less than to the upside) and indicators and some indexes(RUT,DJ,XLF) are lagging.
If the forecast plays out great, but what if I am wrong? - well we stay open minded. This is 18 month cycle low and the rally will last at least 2-3 months. But we have a rally lasting more than 15 months without correction, how much higher? - full blown parabolic move and collapse as every parabola.
TECHNICAL PICTURE
Short term - if the move is so strong any pullback should find support around 1810 and after that a new ATH should follow... than we will see how the charts look like.

Intermediate term - red scenario just follow the price. In green what I think it will happen, this is just a forecast nothing more for now.

- Momentum Histogram/RSI - momentum is up, short term trend is up.
Long term - another green candle confirmed the hammer so the price action is bullish for now and should just follow the market in the next week or two. I do not think that this move will clear the MACD divergence and the move will fail to start another long lasting rally.

- Momentum Histogram/RSI - momentum turned up - intermediate term trend is up.
MARKET BREADTH INDICATORS
The Market Breadth Indicators - oscillators like McClellan Oscillator a strong which is not a surprise after a vertical move, the trend following indicators are not convinced.
McClellan Oscillator - near overbought levels, probably a pullback will follow.
McClellan Summation Index - buy signal,turned up.
Weekly Stochastic of the Summation Index - still on sell, it is a lagging indicator. If my forecast is right it could not issue a buy signal at all.
Bullish Percentage - really weak for a such rally. SP500 is near to it's highs and Bullish percentage barely moved 6 points and it is far bellow the last highs.
Percent of Stocks above MA50 - moved higher after hitting mildly oversold level 25, but still bellow the previous highs.
Fear Indicator VIX - complacency everywhere again. Do not forget - these are levels where VIX is a buy.
Advance-Decline Issues - near overbought levels.
Put/Call ratio - pullback a little bit after the correction, but there is no fear still at elevated levels
HURST CYCLES
The move last week looked like a 20 week cycle bottom now we have the confirmation. 82 trading days nice cycle length. Now the next 40 day cycle is at day 8. If there will be something to the downside the 40 day cycle should start move lower early in the cycle something like day 15 to 20 an this is 2-3 weeks max to the upside.

18 month cycle bottom if I am right. Usually you will see a strong rally lasting for months, but after 15 months without correction it is a little bit suspect.... The alternative is some kind of a top - double top or H&S and top of the 5 year and 9 year cycle. The line in the sand is 1740 the bottom of the last 18 month cycle if the current one moves lower this will mean the cycles of a higher degree 5 and 9 year have toped out.

Tom Demark SEQUENTIAL AND COUNTDOWN - this technique spots areas of exhaustion.
We have price flip on the weekly chart and momentum has turned up. On the daily chart we have 6 of a sell setup and I think it will be finished.

Feb 11, 2014
Update
Its time at least for a pullback
I was expecting 10-15 points pullback and move to the 1810-1815 resistance zone, but SP500 is much stronger moving almost to 1825.... Now I think it should move lower. At 1775 there is gap/support/61,8% Fibo and as long as it stays above this level and it does not move impulsive lower the red scenario is the preferred one. The green one makes more sense for me, but the market does not care what I think:)


Feb 8, 2014
Weekly review
Short term view - we should see topping early next week and the sell off to resume.
Intermediate term view - the correction to continue another 2-3 weeks.
I was expecting a final low on Monday and relief rally... technically ok but the huge bar on Monday surprised me. The pattern has changed and now I do not think, that we have an impulse lower, instead the move looks more like a zigzag. I have suggested that this is an exhaustion bar and short after that we should see the bottom so I hope you have not been fooled to short on monday,took some profits and even took long positions.
The facts are - we have finished zigzag, bullish weekly candle (the huge drop from Monday is erased), sharp rally from support/trend line, the cycles 20 week/18 month could be considered finished, the minimum requirements for a correction are met time/price/indicators. All of this was enough to trigger short covering and late bulls jumping on the "next rally".
What I do not like so I can say the correction is over - 18 month cycle low with only two red weeks... in previous occasions the move lower lasted longer, we saw several corrections 4%-5%-6% through 2013 and this one should be of a bigger degree 8%-10%, sentiment is still at elevated levels the herd has not been scared at all, other indexes are much weaker and the move up is corrective, the August 2007 comparison saw strong rally too and just reversed, if you think this one is strong think twice - 2007 3 days/80 points/5,6% now 3 days/55 points/3,1%.
I like to trade facts/signals and not my expectations/forecast:) I do not like the current situation when facts and forecast point in different directions so I can't and I don't want to tell you what will happen.... we should be open minded now.
I still think that there will be another leg lower, but without confirmation I will not go against the market. I will wait the next several days to see what happens. If the market wants to move lower we should see topping Monday-Tuesday and the week should finish in the red leaving the weekly hammer without confirmation. If the market takes a breath Monday-Tuesday and end the week in green moving above MA50 and resistance 1810 than expect at least the highs to be tested.
P.S. On the charts is shown the forecast.
TECHNICAL PICTURE
Short term - the zigzag is wave W now we are in wave X. Monday Tuesday we should see small pullback 10-15 points another move higher which should stay bellow 1810 and than reversal.
 - Triple cross(EMA10 and EMA20 crossing EMA50) - short term trend is up.
Intermediate term - EMA50, resistance and the broken trend line will be tested and the next leg lower should start.....
 - Trend direction EMA50/MACD - intermediate term rend is down.
- Momentum Histogram/RSI - momentum turned up, short term trend is up.
Long term - we saw bounce near MA50, another green week will confirm the hammer and that another rally higher has begun.
 - Trend direction EMA50/MACD - the long term trend is up - the price above MA50 and MACD above zero. There is scenario that this is the top for the bull market, do not worry there will be a second chance to get out of longs/load on shorts.
- Momentum Histogram/RSI - momentum points down, intermediate term rend is down.
MARKET BREADTH INDICATORS
The Market Breadth Indicators - no signs of a reversal for the intermediate term, the oscillators have warned us to expect something on the upside so the rally is not surprise.
McClellan Oscillator - was mildly oversold,dropping outside its BB so some relief move was expected.
McClellan Summation Index - sell signal.
Weekly Stochastic of the Summation Index - sell signal.
Bullish Percentage - sell signal and dropped bellow 70 which is a warning that probably this is a correction of a bigger degree.
Percent of Stocks above MA50 - touched 25 where usually corrections end in a bull market. Ar least relief rally and we will see if the correction is over.
Fear Indicator VIX - reached 21. For the whole move in 2013 when the VIX reached the 20-22 area this was the end of a correction. It's not are surprise to see such reaction from the traders - they are not scared enough.
Advance-Decline Issues - have not move lower enough to say we have oversold condition... it looks premature the correction to end now.
Put/Call ratio - made a historic low bottom and now it is pulling back, but I do not see fear...
HURST CYCLES
The move is long enough and mature enough so we can have a 20 week cycle bottom. We do not have an edge at this moment using cycles.

18 weeks is long enough and technically we could have 18 month cycle bottom. The rally was strong enough too for a start of the next 20 week/18 moth cycle. I do not like that the move lower was only 2-3 weeks. The previous three 18 month cycles the move to the bottom was bigger and lasted longer. We can only wait and see what happens.

Tom Demark SEQUENTIAL AND COUNTDOWN - this technique spots areas of exhaustion.
On the daily chart we have price flips up and down all the time. That makes the probability for a corrective structure lower(zigzag not an impulse) much higher.
On the weekly chart we have the next bar 3 from a buy setup.
Intermediate term view - the correction to continue another 2-3 weeks.
I was expecting a final low on Monday and relief rally... technically ok but the huge bar on Monday surprised me. The pattern has changed and now I do not think, that we have an impulse lower, instead the move looks more like a zigzag. I have suggested that this is an exhaustion bar and short after that we should see the bottom so I hope you have not been fooled to short on monday,took some profits and even took long positions.
The facts are - we have finished zigzag, bullish weekly candle (the huge drop from Monday is erased), sharp rally from support/trend line, the cycles 20 week/18 month could be considered finished, the minimum requirements for a correction are met time/price/indicators. All of this was enough to trigger short covering and late bulls jumping on the "next rally".
What I do not like so I can say the correction is over - 18 month cycle low with only two red weeks... in previous occasions the move lower lasted longer, we saw several corrections 4%-5%-6% through 2013 and this one should be of a bigger degree 8%-10%, sentiment is still at elevated levels the herd has not been scared at all, other indexes are much weaker and the move up is corrective, the August 2007 comparison saw strong rally too and just reversed, if you think this one is strong think twice - 2007 3 days/80 points/5,6% now 3 days/55 points/3,1%.
I like to trade facts/signals and not my expectations/forecast:) I do not like the current situation when facts and forecast point in different directions so I can't and I don't want to tell you what will happen.... we should be open minded now.
I still think that there will be another leg lower, but without confirmation I will not go against the market. I will wait the next several days to see what happens. If the market wants to move lower we should see topping Monday-Tuesday and the week should finish in the red leaving the weekly hammer without confirmation. If the market takes a breath Monday-Tuesday and end the week in green moving above MA50 and resistance 1810 than expect at least the highs to be tested.
P.S. On the charts is shown the forecast.
TECHNICAL PICTURE
Short term - the zigzag is wave W now we are in wave X. Monday Tuesday we should see small pullback 10-15 points another move higher which should stay bellow 1810 and than reversal.

Intermediate term - EMA50, resistance and the broken trend line will be tested and the next leg lower should start.....

- Momentum Histogram/RSI - momentum turned up, short term trend is up.
Long term - we saw bounce near MA50, another green week will confirm the hammer and that another rally higher has begun.

- Momentum Histogram/RSI - momentum points down, intermediate term rend is down.
MARKET BREADTH INDICATORS
The Market Breadth Indicators - no signs of a reversal for the intermediate term, the oscillators have warned us to expect something on the upside so the rally is not surprise.
McClellan Oscillator - was mildly oversold,dropping outside its BB so some relief move was expected.
McClellan Summation Index - sell signal.
Weekly Stochastic of the Summation Index - sell signal.
Bullish Percentage - sell signal and dropped bellow 70 which is a warning that probably this is a correction of a bigger degree.
Percent of Stocks above MA50 - touched 25 where usually corrections end in a bull market. Ar least relief rally and we will see if the correction is over.
Fear Indicator VIX - reached 21. For the whole move in 2013 when the VIX reached the 20-22 area this was the end of a correction. It's not are surprise to see such reaction from the traders - they are not scared enough.
Advance-Decline Issues - have not move lower enough to say we have oversold condition... it looks premature the correction to end now.
Put/Call ratio - made a historic low bottom and now it is pulling back, but I do not see fear...
HURST CYCLES
The move is long enough and mature enough so we can have a 20 week cycle bottom. We do not have an edge at this moment using cycles.

18 weeks is long enough and technically we could have 18 month cycle bottom. The rally was strong enough too for a start of the next 20 week/18 moth cycle. I do not like that the move lower was only 2-3 weeks. The previous three 18 month cycles the move to the bottom was bigger and lasted longer. We can only wait and see what happens.

Tom Demark SEQUENTIAL AND COUNTDOWN - this technique spots areas of exhaustion.
On the daily chart we have price flips up and down all the time. That makes the probability for a corrective structure lower(zigzag not an impulse) much higher.
On the weekly chart we have the next bar 3 from a buy setup.

Feb 6, 2014
Update
Monday was exhaustion bar as I have suggested, than we saw waves 4 and 5 of smaller degree and now the retracement.
The plunge on Monday was too big and I think we do not have an impulse from the top but a zigzag. This is important because it means that we have another corrective structure lower and after the correction is over we should expect another higher high which is my preferred scenario.


Feb 4, 2014
Update
If the count from yesterday is right (it looks like we have wave iv) the target for the bottom should be around 1730 support and trend line.


Feb 3, 2014
Update
UPDATE - I wrote many times, that there is too much greed and it is purged with sharp declines.... well now you know how it looks like. It was not different this time. I thought we will see such think after a rebound for 2-3 days.
UPDATE - support and trend line hit now a bounce for iv expected...
I wrote that the EW picture is not clear and I will switch to TA which says "lower on Monday, probably with lower low".... now I think the mess starts making sense from EW perspective too. Wave 4 was not over and it was a rare expanding flat and now we should be in iii of 5. If I am right support around 1750 should hold and the MACD divergence should not be negated, else the next move lower has begun and it will feel like a crash.


Feb 1, 2014
Weekly review
Short term view - rally for several days.
Intermediate term view - the correction to continue for another 2-4 weeks.
No surprises this week - lower low as expected and the indexes are trying to turn up now.
The market action is very choppy the easy part with the predictions is over... EW guided us great lower to the first support level. Now it is difficult I see to many options and I will concentrate only on TA:
- It looks like the price wants to make a turn but it takes time, you can not make U-turn with 100mph:) and this is the "fight" which we are seeing.
- Look at the daily chart - the Histogram reached oversold levels and we usually see a bounce from such levels.
- McClellan Oscillator making higher lows - seller are getting weaker.
- The pattern from August 2007 continue working 1:1 for now, I looked at the indicators and they are looking exactly the same way.
My conclusion - the hourly chart looks like it wants to move lower and Monday will probably start in the red, but after the low is in(it could be a lower low) a move to the upside should begin 1800 minimum and I expect something around ~1812.
How to trade it? - you can see clear the trading range 1770-1772 tested three times and 1794-1796 tested 3-4 times. Wait for the opening if the market fails to make lower low and turns up go long with stop bellow 1770 or if we see a lower low(probably 1760 next support) with MACD divergence on the hourly chart go long when the price get back above 1770 and put a stop bellow the low.
TECHNICAL PICTURE
Short term - short living move lower on Monday, probably with lower low, should mark the low for the move from 1850 and rebound should begin. I will watch the 50% Fibo retracement around 1812.
 - Triple cross(EMA10 and EMA20 crossing EMA50) - the short term trend is down.
Intermediate term - Look at the histogram... when we see such extremes a rebound for several days follows. Other indicators support the idea so the next bottom lower or not is a short term buy. I think that the broken middle trend line and MA50 will be tested and they are exactly at 50% Fibo retracement 1812...
 - Trend direction EMA50/MACD - the intermediate term trend is down.
- Momentum Histogram/RSI - momentum is trying to turn up.
Long term - the weekly chart says we are in an intermediate term correction and it is early to expect a bottom.
 - Trend direction EMA50/MACD - the long term trend is up - the price above MA50 and MACD above zero. There is scenario that this is the top for the bull market, do not worry there will be a second chance to get out of longs/load on shorts.
- Momentum Histogram/RSI - momentum is down, intermediate term trend is down.
MARKET BREADTH INDICATORS
The Market Breadth Indicators - the trend following indicators are on sell we are in a correction. Short term indicators say we should see a rebound.
McClellan Oscillator - is making second higher low and the sellers are looking exhausted.
McClellan Summation Index - sell signal.
Weekly Stochastic of the Summation Index - sell signal.
Bullish Percentage - dropped bellow 70 for the firs time since June. I think that this time the correction is for real.
Percent of Stocks above MA50 - higher low... there is still room to the downside. We should see the indicator moving bellow 25 before this move is over.
Fear Indicator VIX - again outside it's BB, shooting star, hanging man, black candles - I think we will see a pullback which means a rebound for the stocks.
Advance-Decline Issues - moving lower after divergences, which is what you want to see... there is a lot of room to the downside.
HURST CYCLES
The 40 day cycle working as expected. Come on... another 10-13 days to reach the same size like the previous one 47/46/46.

Another 2-3 weeks lower and the current 20 week cycle and the 18 month cycle will look very good.
Tom Demark SEQUENTIAL AND COUNTDOWN - this technique spots areas of exhaustion.
Buy setup was invalidated at day 7. We have now a price flip which confirms that momentum tries to turn up.

Intermediate term view - the correction to continue for another 2-4 weeks.
No surprises this week - lower low as expected and the indexes are trying to turn up now.
The market action is very choppy the easy part with the predictions is over... EW guided us great lower to the first support level. Now it is difficult I see to many options and I will concentrate only on TA:
- It looks like the price wants to make a turn but it takes time, you can not make U-turn with 100mph:) and this is the "fight" which we are seeing.
- Look at the daily chart - the Histogram reached oversold levels and we usually see a bounce from such levels.
- McClellan Oscillator making higher lows - seller are getting weaker.
- The pattern from August 2007 continue working 1:1 for now, I looked at the indicators and they are looking exactly the same way.
My conclusion - the hourly chart looks like it wants to move lower and Monday will probably start in the red, but after the low is in(it could be a lower low) a move to the upside should begin 1800 minimum and I expect something around ~1812.
How to trade it? - you can see clear the trading range 1770-1772 tested three times and 1794-1796 tested 3-4 times. Wait for the opening if the market fails to make lower low and turns up go long with stop bellow 1770 or if we see a lower low(probably 1760 next support) with MACD divergence on the hourly chart go long when the price get back above 1770 and put a stop bellow the low.
TECHNICAL PICTURE
Short term - short living move lower on Monday, probably with lower low, should mark the low for the move from 1850 and rebound should begin. I will watch the 50% Fibo retracement around 1812.

Intermediate term - Look at the histogram... when we see such extremes a rebound for several days follows. Other indicators support the idea so the next bottom lower or not is a short term buy. I think that the broken middle trend line and MA50 will be tested and they are exactly at 50% Fibo retracement 1812...

- Momentum Histogram/RSI - momentum is trying to turn up.
Long term - the weekly chart says we are in an intermediate term correction and it is early to expect a bottom.

- Momentum Histogram/RSI - momentum is down, intermediate term trend is down.
MARKET BREADTH INDICATORS
The Market Breadth Indicators - the trend following indicators are on sell we are in a correction. Short term indicators say we should see a rebound.
McClellan Oscillator - is making second higher low and the sellers are looking exhausted.
McClellan Summation Index - sell signal.
Weekly Stochastic of the Summation Index - sell signal.
Bullish Percentage - dropped bellow 70 for the firs time since June. I think that this time the correction is for real.
Percent of Stocks above MA50 - higher low... there is still room to the downside. We should see the indicator moving bellow 25 before this move is over.
Fear Indicator VIX - again outside it's BB, shooting star, hanging man, black candles - I think we will see a pullback which means a rebound for the stocks.
Advance-Decline Issues - moving lower after divergences, which is what you want to see... there is a lot of room to the downside.
HURST CYCLES
The 40 day cycle working as expected. Come on... another 10-13 days to reach the same size like the previous one 47/46/46.

Another 2-3 weeks lower and the current 20 week cycle and the 18 month cycle will look very good.

Tom Demark SEQUENTIAL AND COUNTDOWN - this technique spots areas of exhaustion.
Buy setup was invalidated at day 7. We have now a price flip which confirms that momentum tries to turn up.

Subscribe to:
Posts (Atom)
