Dec 27, 2013
Update
The last INVESTORS INTELLIGENCE SURVEY - more bulls, fewer bears... SP500 toooo stretched above MA200.
John Hampson:
Investors Intelligence bulls up to 59.6% from 58.2%. Highest since 62% in October 2007
Investors Intelligence bears down to 14.1% from 14.3%. Lowest since March ’87
The S&P Index today is farther above its 200 day moving avg then at any time in the last 25 yrs — with the exception of mid to late 09
Two of the bloggers which I follow think now, that this is a blow off top and we will not see a topping process. I will post some thoughts on the topic next year... in fact the topping pattern which I was showing for more than six months(weekly chart) was negated and the alternate pattern blow off sounds logical now.
John Hampson - thinks now that the top will be blow off top.
Toby Connor - another guy which I follow... one more bear:)
Dec 26, 2013
Update
The first target has been reached... I do not see an ending pattern for now. You should be worried if SP500 moves bellow 1810.
I do not follow many blogs, but two of the guys which I respect turned bearish a few weeks ago. I know that when you are bearish you like to read bearish stuff(simple psychology), but they were bullish for a long time and they are smarter than me:). Common sense tells me they are right. Now we can only wait and see if this time greed and madness is stronger than history and common sense.
Just a clarification - I am talking about intermediate term trend and the next bigger move. This is not a problem to be bullish short term as I wrote around the FOMC bottom. I am writing about that for a long time and the difference now is that a lot of different markets are in their final 5-th wave.
Something to read:
Nouf - He is good in counting EW. Obviously he can read my thoughts too:)
John Hampson's blog - makes a good point for the bearish case... He is long term trader and uses more fundamental stuff and solar cycles.
Dec 20, 2013
Weekly review
Short term view - more upside with targets 1830 or 1860.
Intermediate term view - I still think that the next bigger move is a correction.
This is the last post for the year, the next one will be in the second week of January. I wish all of you Merry Christmas, Happy New Year and enjoy the holidays:)
Last week I wrote expect test of the highs or marginal new high. Given the strength, the holidays with low volume... I think the scenario with new ATH is 100% sure. Some indexes like XLF which were missing the final wave will finish it in the next week or two...
For the short term there is more upside and I see two cases, for the intermediate term I still think that we will see sharp correction.
- case one A-B-C move with target around 1830. Interesting is if you remember the EW charts target was 1829 - coincidence??? I will take my hat off to EW if SP500 top out at 1830:) That is my preferred scenario... but we will just watch the charts they will tell us what is going on.
- case two an impulse will develop with target 1860 - this target matches with the upper purple trend line(see the daily chart) and reverse H&S with neckline 1810(see the hourly chart)
If we see in the next two days another huge bar 20 points expect impulse case two 1860, if not case one 1830.
TECHNICAL PICTURE
Short term - A-B-C is shown but it could be something else... reverse H&S? Do not think to much there is more upside for the short term.

Intermediate term - I find it interesting that both measures point exactly to the upper trend lines - 1830 yellow and 1860 purple.

Long term - soon we will know if I am right or wrong. The indexes are moving sideways for 5 weeks and I think they are topping for the intermediate term. Just one final high left...

MARKET BREADTH INDICATORS
The Market Breadth Indicators - some indicators are weakening... huge bar SP500 closing ATH, 3 points bellow ATH and yet Bullish Percentage does not react to the upside,Percent of Stocks above MA50 at 66 not even close to the previous highs. It is not normal - weakness? I think this rally is soon dead. Playing with ATH and only 66% of the shares are above MA50 this is a joke.
McClellan Oscillator - reseted its mildly oversold levels.
McClellan Summation Index - sell signal.
Weekly Stochastic of the Summation Index - sell signal.... reached oversold levels. I hope it will stay there for several weeks.
Bullish Percentage - barely moved up and still on sell.
Percent of Stocks above MA50 - October-November-December highs huge divergences.
Fear Indicator VIX - it was overbought and pullback was expected. Just higher low nothing more.
Advance-Decline Issues - in the middle of the range no strength, but not enough weakness.
Put/Call ratio - no more call buyers?
Percent of Stocks above MA200 - I would expect to see it at 90% not at 60% with such massive rally for more than a year.
HURST CYCLES
After the first the first strong candle from MA50 I wrote that this is the low for the 40 day cycle. Now it is confirmed. I think the 20 week cycle is the dominant and we will see straddled-troughs, with other words something like double top or H&S.

Dec 18, 2013
Update
From the weekend - "So my best guess is short term bottom FOMC and drifting higher through the holidays. XLF probably will finish its count, SP500 could test the highs again or make marginal new high."
I just did not expect it to happen in one day:) - SP500 made lower low today and now it is a few points from the top.
The move is too strong so new highs are sure given the holidays and the expected low volume. The chart updated. The bears were killed again, including me:) I have forecasted new high, but it is a little bit too much for one day... so it is not time to be bearish.... short term.


Dec 16, 2013
Update
I was expecting a low today and move higher tomorrow or Wednesday FOMC. Well the low was overnight, the futures dropped 15 points and we have short term low. I expect the move to continue at least until FOMC.
I see two scenarios - the moves continue until FOMC or Friday OPEX and alternate scenario the "Christmas rally" to extend into the next week grinding slowly higher with low volume. Expect lower high the first scenario and new marginal ATH the second one.
Given the strength today and the indicators, the alternate scenario shown in the weekly review with 40 day cycle low on Friday at day 46 looks better.
I think the 20 week cycle is the dominant and we will see straddled-troughs.


Dec 15, 2013
Time to be brave or stupid...
Take a look at the two charts bellow and ask yourself - is it time to be brave or stupid.
A bull will say be brave buy,buy,buy... the bears are stupid they have missed such a great opportunity. Ok that was the past, buy now and expect what? The prices to go perpendicular... at this point I prefer to be called stupid and miss "Christmas rally", another 5% what ever. I prefer to be smart and not too greedy and take my chips of the table.
I wrote about mania... well it can always get crazier:) - Zerohedge Peak "Greater Fools"
Latest Investor's Intelligence survey:
- Bull/Bear ratio at 4 - the highest value ever recorded... yes you have read it right.
- Bears 14,3% - the only time "bears" have been less than now was in 1987... that does not ended good.
I ask myself is there sellers left? It looks like everybody are at one side of the boat fully invested. Is there buyers left?
 The chart speaks for it self - DJ reached the upper trend line, double MACD divergence, double RSI divergence, a lot of similarities with previous tops, peak sentiment....
Is see three possible scenarios:
- the index continues higher and the divergence are erased. For that to happen the trajectory should become even more steeper,that means perpendicular... 90 degree rise with this sentiment... good luck with that.
- the index crawls slowly sideways for months even longer until the indicators are cleared, the fundamentals to catch up with price... ok than start praying, that all this margin debt do not start unwinding.
- what history says - excess mania and greed in bull markets is being purged through very sharp 10%-20% and short living several weeks correction. That is my scenario - I will bet that human beings are the same stupid and greedy idiots.
Pick your scenario and be brave or stupid:)
The chart speaks for it self - DJ reached the upper trend line, double MACD divergence, double RSI divergence, a lot of similarities with previous tops, peak sentiment....
Is see three possible scenarios:
- the index continues higher and the divergence are erased. For that to happen the trajectory should become even more steeper,that means perpendicular... 90 degree rise with this sentiment... good luck with that.
- the index crawls slowly sideways for months even longer until the indicators are cleared, the fundamentals to catch up with price... ok than start praying, that all this margin debt do not start unwinding.
- what history says - excess mania and greed in bull markets is being purged through very sharp 10%-20% and short living several weeks correction. That is my scenario - I will bet that human beings are the same stupid and greedy idiots.
Pick your scenario and be brave or stupid:)


Weekly review
Short term view - one final lower low and short term bottom FOMC 18.12
Intermediate term view - intermediate term top should be in and I expect another 4-6 weeks of weakness to finish the correction.
SP500 made something like double top DJ more like H&S the call for a short at 1810 was very good so this week has not disappointed us:)
Now the charts are looking a little bit confusing...
- The weekly charts are looking bad - divergences MACD/RSI, TomDemark bearish price flip momentum has turned lower, bearish candle stick formation and this week candlestick closed bellow it, the last 4-6 weeks of 18 month cycle.
- On the other side the move is still not strong enough. We still do not have serious technical damages. On the daily chart you can count the move as A-B-C, the oscillators are nearing oversold levels (short term bottom?), FOMC and holidays(low volume) are coming which favors the upside. Some indexes look weak and finished their EW counts - Russell 2000, DAX, FTSE others like SP500 not so weak and XLF for example has not finished it's count.
Usually the bigger time frame wins(weekly), but in the near term it is not a problem that the smaller one(daily) plays out.
So my best guess is short term bottom FOMC(or the previous day) and drifting higher through the holidays. XLF probably will finish its count, SP500 could test the highs again or make marginal new high.
We will just wait and see what happens. If you are short from 1810 for example just put a stop on break even or several points lower and enjoy the holidays:) If we see something interesting you can even go long.
TECHNICAL PICTURE
Short term - one final low and at least a retracement. Probable target the broken trend line around 1805. If I am wrong marginal new high around 1840.
 - Triple cross(EMA10 and EMA20 crossing EMA50) - negative, short term trend is down.
Intermediate term - the same story, both scenarios.... we must be prepared and keep an eye on alternate scenarios if we are wrong.
 - Trend direction EMA50/MACD - the intermediate term trend is up, but we are seeing now double MACD divergence. Watch out for a trend reversal.
- Momentum Histogram/RSI - momentum is down, short term trend is down.
Long term - the weekly chart says it looks bad, intermediate top is in.
 - Trend direction EMA50/MACD - long term trend is up - the price above MA50 and MACD above zero. Watch out for the MACD divergence - something bad could happen.
- Momentum Histogram/RSI - turned lower, it looks like the intermediate term reversed to the downside.
MARKET BREADTH INDICATORS
The Market Breadth Indicators - are negative as the last week, but showed a little bit more enthusiasm to the downside:)
McClellan Oscillator - made another lower low and bouncing from slightly oversold levels.
McClellan Summation Index - sell signal moving down.
Weekly Stochastic of the Summation Index - sell signal.... reached oversold levels. I hope it will stay there for several weeks.
Bullish Percentage - sell signal... showed some signs of life.
Percent of Stocks above MA50 - in the middle of the range... we are in a correction??
Fear Indicator VXO - shot up to 16... as i said there will be explosive move to the upside. Are the traders nervous?
Advance-Decline Issues - weak and probably we are nearing short term bottom with the indicator nearing oversold levels.
Put/Call ratio - third peak in a row...
Percent of Stocks above MA200 - continue falling... Think about it for a second, we are near to the highs huge rally and 41% of the stocks are in bear territory bellow MA200 and only 59% above it.... how is this bullish???
HURST CYCLES
If wee see only a retracement the bottom was at day 41. If we see a surprise, stronger than expected move to the upside, the bottom will be Friday at day 47.

The weekly chart looks on track and we should see 4 to 6 weeks correction.

Tom Demark SEQUENTIAL AND COUNTDOWN - this technique spots areas of exhaustion.
The weekly candles look definitely bearish... and we have this week price flip - the momentum has turned lower.

Intermediate term view - intermediate term top should be in and I expect another 4-6 weeks of weakness to finish the correction.
SP500 made something like double top DJ more like H&S the call for a short at 1810 was very good so this week has not disappointed us:)
Now the charts are looking a little bit confusing...
- The weekly charts are looking bad - divergences MACD/RSI, TomDemark bearish price flip momentum has turned lower, bearish candle stick formation and this week candlestick closed bellow it, the last 4-6 weeks of 18 month cycle.
- On the other side the move is still not strong enough. We still do not have serious technical damages. On the daily chart you can count the move as A-B-C, the oscillators are nearing oversold levels (short term bottom?), FOMC and holidays(low volume) are coming which favors the upside. Some indexes look weak and finished their EW counts - Russell 2000, DAX, FTSE others like SP500 not so weak and XLF for example has not finished it's count.
Usually the bigger time frame wins(weekly), but in the near term it is not a problem that the smaller one(daily) plays out.
So my best guess is short term bottom FOMC(or the previous day) and drifting higher through the holidays. XLF probably will finish its count, SP500 could test the highs again or make marginal new high.
We will just wait and see what happens. If you are short from 1810 for example just put a stop on break even or several points lower and enjoy the holidays:) If we see something interesting you can even go long.
TECHNICAL PICTURE
Short term - one final low and at least a retracement. Probable target the broken trend line around 1805. If I am wrong marginal new high around 1840.

Intermediate term - the same story, both scenarios.... we must be prepared and keep an eye on alternate scenarios if we are wrong.

- Momentum Histogram/RSI - momentum is down, short term trend is down.
Long term - the weekly chart says it looks bad, intermediate top is in.

- Momentum Histogram/RSI - turned lower, it looks like the intermediate term reversed to the downside.
MARKET BREADTH INDICATORS
The Market Breadth Indicators - are negative as the last week, but showed a little bit more enthusiasm to the downside:)
McClellan Oscillator - made another lower low and bouncing from slightly oversold levels.
McClellan Summation Index - sell signal moving down.
Weekly Stochastic of the Summation Index - sell signal.... reached oversold levels. I hope it will stay there for several weeks.
Bullish Percentage - sell signal... showed some signs of life.
Percent of Stocks above MA50 - in the middle of the range... we are in a correction??
Fear Indicator VXO - shot up to 16... as i said there will be explosive move to the upside. Are the traders nervous?
Advance-Decline Issues - weak and probably we are nearing short term bottom with the indicator nearing oversold levels.
Put/Call ratio - third peak in a row...
Percent of Stocks above MA200 - continue falling... Think about it for a second, we are near to the highs huge rally and 41% of the stocks are in bear territory bellow MA200 and only 59% above it.... how is this bullish???
HURST CYCLES
If wee see only a retracement the bottom was at day 41. If we see a surprise, stronger than expected move to the upside, the bottom will be Friday at day 47.

The weekly chart looks on track and we should see 4 to 6 weeks correction.

Tom Demark SEQUENTIAL AND COUNTDOWN - this technique spots areas of exhaustion.
The weekly candles look definitely bearish... and we have this week price flip - the momentum has turned lower.

Dec 12, 2013
Update
I think another 5 wave sequence has finished.... now watching the 38,2% and 50% Fibo retracement.


Dec 10, 2013
Update
Two days later we do not have continuation even with another double POMO yesterday. This confirms that the huge candle is not the start of another rally probably short covering as I have expected.
The current move since October is for me definitely not an impulse. The best what I have come up with is shown bellow on the chart.
If we see see ATH expect another 3 wave structure probably Z to 1840-1850.
If SP500 does not make another ATH the move has finished as a double zigzag W-X-Y(preferred scenario). If you have followed my advice yesterday, you can sit back and relax now:) you will not miss anything to the down side.


Dec 9, 2013
Update
UPDATE: the move looks corrective,the price do not want go lower, I expect something to the upside....
If you are bearish an look for an entry now it's perfect - broken trend line retested,MACD divergences on the smaller time frames, stop at 1815 above ATH only 5 points risk.....


Dec 8, 2013
Weekly review
Short term view - no idea...
Intermediate term view - I still think that SP500 either toped out or we will see soon an intermediate term top.
The call for a top last week was right and the forecasts throughout the week were right too... the only caveat now is that the retracement is stronger than expected, moved above 1800 and closed near the highs of the day printing huge bar. The bears were killed again and the bulls are cheering.
Positive:
- trend reversal is still not confirmed, the next 40 day cycle has begun, strong move with huge gap...
Negative:
- in fact nothing has changed - we have the same negative signals as for the last several weeks. 30 points lower has not reseted the indicators, scared the herd etc. so that we can think of the next rally.
- If EW matters after 5 wave impulse and a retracement another move lower should be expected.
- The last three weeks SP500 is not advancing the weekly histogram ticked lower and we are seeing reversal candlesticks - hanging man, dragon fly doji and the formations looks like evening star (see the last chart). That makes me think that the index is topping.
Short term - I do not know. H&S, double top,marginal new highs... everything is possible. One strong day does not mean anything, it could be the exhaustion bar which you see around tops. It was missing till now - huge gap and huge bar. They appear short before, short after or at the top(see the daily chart). How to make a difference - if there will be more upside, in the next two days we should see another huge bar, if the bulls can not master a rally in the next two days this is an exhaustion bar and part of the topping process.
Intermediate term - you know what I think - intermediate term top and for the next 5-7 weeks I am bearish. If I am wrong.... the indexes will go vertical above 1900.
How to trade - wait to see what happens. My opinion stays the same - if you see a spike higher or a move bellow 1800 take another portion of the profits.
TECHNICAL PICTURE
Short term - Head and Shoulders, double top, another rally I can not tell you.....
 - Triple cross(EMA10 and EMA20 crossing EMA50) - positive,short term trend up, but be careful for a reversal and H&S
Intermediate term - it looks like topping process to me...
Around tops you will always see a strong move(exhaustion bar) to suck all the traders in kill the shorts. Till now it was missing and the bearish case looks better now. - Trend direction EMA50/MACD - the intermediate term trend is up, but we are seeing now double MACD divergence. Watch out for a trend reversal.
- Momentum Histogram/RSI - ticked up.
Long term - we have reached the point where the price should decide to follow the pattern, as for the last 6 months, or it will negate it and go parabolic.
 - Trend direction EMA50/MACD - long term trend is up - the price above MA50 and MACD above zero. Watch out for the MACD divergence.
- Momentum Histogram/RSI - ticked lower, intermediate term reversal?
MARKET BREADTH INDICATORS
The Market Breadth Indicators - no change. The indicators are negative and do not support the idea for a rally at the moment.
McClellan Oscillator - made lower low for the first time since June. Early warning for a reversal?
McClellan Summation Index - sell signal.
Weekly Stochastic of the Summation Index - sell signal.
Bullish Percentage - sell signal.
Percent of Stocks above MA50 - another lower high expected.
Fear Indicator VXO - spiked higher... I think it started a move higher.
Advance-Decline Issues - continue to show weakness.
Put/Call ratio - the traders are very enthusiastic again
Percent of Stocks above MA200 - continue falling.
HURST CYCLES
I think the second 40 day cycle has begun. Until now the 40 day cycle were fairly symmetrical, now I think the 80 days cycle will be symmetrical and we will see straddled troughs. We are several weeks away from 18 months cycle low and think correction has higher probability than a rally.

The same length and size as the previous 18 month cycle has been reached. From cycles point of view - there is only one direction in the next 5-7 weeks and it is down.

Tom Demark SEQUENTIAL AND COUNTDOWN - this technique spots areas of exhaustion.
Nothing interesting to show. This is just a closer view of the weekly chart to see the last three weeks.

Intermediate term view - I still think that SP500 either toped out or we will see soon an intermediate term top.
The call for a top last week was right and the forecasts throughout the week were right too... the only caveat now is that the retracement is stronger than expected, moved above 1800 and closed near the highs of the day printing huge bar. The bears were killed again and the bulls are cheering.
Positive:
- trend reversal is still not confirmed, the next 40 day cycle has begun, strong move with huge gap...
Negative:
- in fact nothing has changed - we have the same negative signals as for the last several weeks. 30 points lower has not reseted the indicators, scared the herd etc. so that we can think of the next rally.
- If EW matters after 5 wave impulse and a retracement another move lower should be expected.
- The last three weeks SP500 is not advancing the weekly histogram ticked lower and we are seeing reversal candlesticks - hanging man, dragon fly doji and the formations looks like evening star (see the last chart). That makes me think that the index is topping.
Short term - I do not know. H&S, double top,marginal new highs... everything is possible. One strong day does not mean anything, it could be the exhaustion bar which you see around tops. It was missing till now - huge gap and huge bar. They appear short before, short after or at the top(see the daily chart). How to make a difference - if there will be more upside, in the next two days we should see another huge bar, if the bulls can not master a rally in the next two days this is an exhaustion bar and part of the topping process.
Intermediate term - you know what I think - intermediate term top and for the next 5-7 weeks I am bearish. If I am wrong.... the indexes will go vertical above 1900.
How to trade - wait to see what happens. My opinion stays the same - if you see a spike higher or a move bellow 1800 take another portion of the profits.
TECHNICAL PICTURE
Short term - Head and Shoulders, double top, another rally I can not tell you.....

Intermediate term - it looks like topping process to me...
Around tops you will always see a strong move(exhaustion bar) to suck all the traders in kill the shorts. Till now it was missing and the bearish case looks better now.

- Momentum Histogram/RSI - ticked up.
Long term - we have reached the point where the price should decide to follow the pattern, as for the last 6 months, or it will negate it and go parabolic.

- Momentum Histogram/RSI - ticked lower, intermediate term reversal?
MARKET BREADTH INDICATORS
The Market Breadth Indicators - no change. The indicators are negative and do not support the idea for a rally at the moment.
McClellan Oscillator - made lower low for the first time since June. Early warning for a reversal?
McClellan Summation Index - sell signal.
Weekly Stochastic of the Summation Index - sell signal.
Bullish Percentage - sell signal.
Percent of Stocks above MA50 - another lower high expected.
Fear Indicator VXO - spiked higher... I think it started a move higher.
Advance-Decline Issues - continue to show weakness.
Put/Call ratio - the traders are very enthusiastic again
Percent of Stocks above MA200 - continue falling.
HURST CYCLES
I think the second 40 day cycle has begun. Until now the 40 day cycle were fairly symmetrical, now I think the 80 days cycle will be symmetrical and we will see straddled troughs. We are several weeks away from 18 months cycle low and think correction has higher probability than a rally.

The same length and size as the previous 18 month cycle has been reached. From cycles point of view - there is only one direction in the next 5-7 weeks and it is down.

Tom Demark SEQUENTIAL AND COUNTDOWN - this technique spots areas of exhaustion.
Nothing interesting to show. This is just a closer view of the weekly chart to see the last three weeks.

Dec 7, 2013
Another EW chart
Tomorrow I will post the weekly review...
XLF another proxy for SP500... again I can not see an impulse, either I have no idea of EW or I have put my bearish glasses:)
XLF chart from the 2011 bottom(the second part of this cyclical bull) - I see three wave sequences.... W-X-Y and triple zigzag for Y which should finish in the next several days.
Proportions look very good - The black waves Y=1.74xW | The red waves W=Z=3 Y=5.4=1.8x3 X=1.3/1.7 | The blue waves A=C=2.3 (C finishes ~21.8)
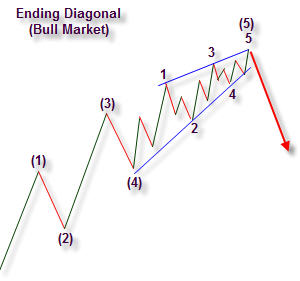
 And the closer look of the last wave z - one final high should finish the ending diagonal for "c" of "z" of "Y". Divergence between "a" and "c" and between 3 and 5 of the ending diagonal.


Dec 5, 2013
Update
Ok for now the price action follows the plan... the corrective moves are tricky let's see how it will play out. The bigger picture - we had one leg lower and I think we will see second one lower before a short term bottom. Target area 1735-1745.


Dec 3, 2013
Signals
Short term signal: DOWN - it will turn up above 1800
Intermediate term signal: DOWN - it will turn up above 1800
Comment: I think a pullback has begun. The move looks like an impulse for now....
Double POMO today and the market is selling all day... all of a sudden it does not work???
Watch price behavior for clues:
- intermediate term top - at least two consecutive down days of strong selling breaking bellow 1775.
- bullish moves continue higher - any pullback should stay above 1775.
Levels to watch SP500:
- 1745-1740 - minor support
- 1715-1730 - important support
It looks like an impulse to me.... Which means expect more downside. Target for wave 5 if the count is right around 1787 where MA20 is on the daily chart, than rebound - should stay bellow 1810.
UPDATE - I think wave 3(or 5) has just finished with ending diagonal touching 1787...
 If this plays out, it will be technical analysis in all it's beauty:)


Dec 2, 2013
Signals
Short term signal: UP - it will turn down bellow 1800
Intermediate term signal: UP - it will turn down bellow 1795
Comment: We did not get the answer today. The price is playing with the trend line and support 1800, but the charts are looking toppy...
Tomorrow is heavy POMO day... I do not know if we will see this final 5-th wave for a perfect pattern. Often the patterns are not perfect, or it will be too easy.
If SP500 opens tomorrow bellow 1800 I will bet, that a pullback has begun and POMO will lead only to a test of the broken wedge trend line. If is
Watch price behavior for clues:
- intermediate term top - at least two consecutive down days of strong selling breaking bellow 1775.
- bullish moves continue higher - any pullback should stay above 1775.
Levels to watch SP500:
- 1745 - minor support
- 1715-1730 - important support


Dec 1, 2013
Signals
Short term signal: UP - it will turn down bellow 1800
Intermediate term signal: UP - it will turn down bellow 1795
Comment: It is time to start posting the signals again. They were up till now, nothing worth mentioning, but after the targets has been reached and
the divergences all over the place it is time to be cautious. Look at the hourly,daily and weekly chart from the weekly review - MACD double divergence
on all time frames.... I do not know what do you think but in my opinion it is time to step aside(start taking profits).
The charts look to me like they hit some kind of a top or it will be on Tuesday which is heavy POMO day(see the hourly chart bellow).
Watch price behavior for clues:
- intermediate term top - at least two consecutive down days of strong selling breaking bellow 1775.
- bullish moves continue higher - any pullback should stay above 1775.
Levels to watch SP500:
- 1745 - minor support
- 1715-1730 - important support
The wedges are everywhere the hourly chart, the daily chart. The buyers are eager to buy as soon as possible not letting even a small pullback to play out.
Too much greed..... MACD double divergences on all time frames,wedges... I will dare to say expect a top next week:)


Nov 30, 2013
Weekly review
Short term view - I am not sure if a pullback has begun or one more push higher is in the cards. Wait for the opening on Monday.
Intermediate term view - if we see a pullback this should be the beginning of the correction.
The indexes squeezed several points higher and finished flat for the week - exactly according to the plan. SP500 reached the 1810-1815 target which I showed with the inverted H&S for two weeks I think.
Short term there is two scenarios - the ending diagonal, which I showed during the week, looks much better as a pattern. On the other side it could be an impulse which has finished - with the "huge" bar (compared to the others) and the double MACD divergence(see the hourly chart) make this scenario more probable. On Monday we will know more - if we see a gap and decisive move bellow 1800 pullback has begun, if we see the price stalling at the 1795-1800 level than it is just 4 of ending diagonal.
Intermediate term - nothing has changed. I think we are in a "mania" phase (see the previous post). There is a lot more indicators, which are suggesting the same - huge "excitement" comparable with the previous two tops 2000 and 2007. The problem with such "mania" phases is, that you do not know, when they will end. All we know is that they end bad... always.
This levels 1810-1825 are a good area for a reversal. The signals are aligning - EW,Cycles,TD sequential, indicators... well let's see if this time all this will materialize into a pullback.
TECHNICAL PICTURE
Short term - here the two scenarios - the wedge(red) looks better as a pattern, the reversal(green) looks more promising from TA stand point.
 - Triple cross(EMA10 and EMA20 crossing EMA50) - positive,short term trend up, but be careful for a reversal we have double MACD divergence.
Intermediate term - waiting for the correction.... we will see if I am right.
 - Trend direction EMA50/MACD - the intermediate term trend is up, but we are seeing now double MACD divergence. Watch out for a trend reversal.
- Momentum Histogram/RSI - Momentum ticked lower with another histogram divergence. Short term trend reversal is possible.
Long term - we have reached the point where the price should decide to follow the pattern, as for the last 6 months, or it will negate it and go parabolic.
 - Trend direction EMA50/MACD - long term trend is up - the price above MA50 and MACD above zero. Watch out for the MACD divergence.
- Momentum Histogram/RSI - momentum is up, the intermediate term trend is up.
MARKET BREADTH INDICATORS
The Market Breadth Indicators - nothing changed....
McClellan Oscillator - another lower high and divergence is coming.
McClellan Summation Index - trying to generate buy signal... the next divergence.
Weekly Stochastic of the Summation Index - sell signal.
Bullish Percentage - buy signal, do not get exited:)
Percent of Stocks above MA50 - yet another divergence... new ATH and another lower peak.
Fear Indicator VXO - BB even more narrow... expect explosive move in some direction. And strong candle on Friday, pullback has begun??
Advance-Decline Issues - expect another lower high and divergence of a bigger degree.
Put to call ratio - making several lower highs.
HURST CYCLES
The top of the 40 day cycle is already long overdue....

At week 54 of the 18 month cycle. It has reached size and length where we should see the top of the cycle. Now it should be only downhill for the next 4 to 7 weeks... come on mother nature you are stronger than the FED:)

Tom Demark SEQUENTIAL AND COUNTDOWN - this technique spots areas of exhaustion.
Countdown could finish with 13 making just higher high(green short term top is in) or we will see one last surge(red scenario wave 5) to finish the countdown.
The rules are not exact in this case - no edge here. The message is we are near to a top.

Intermediate term view - if we see a pullback this should be the beginning of the correction.
The indexes squeezed several points higher and finished flat for the week - exactly according to the plan. SP500 reached the 1810-1815 target which I showed with the inverted H&S for two weeks I think.
Short term there is two scenarios - the ending diagonal, which I showed during the week, looks much better as a pattern. On the other side it could be an impulse which has finished - with the "huge" bar (compared to the others) and the double MACD divergence(see the hourly chart) make this scenario more probable. On Monday we will know more - if we see a gap and decisive move bellow 1800 pullback has begun, if we see the price stalling at the 1795-1800 level than it is just 4 of ending diagonal.
Intermediate term - nothing has changed. I think we are in a "mania" phase (see the previous post). There is a lot more indicators, which are suggesting the same - huge "excitement" comparable with the previous two tops 2000 and 2007. The problem with such "mania" phases is, that you do not know, when they will end. All we know is that they end bad... always.
This levels 1810-1825 are a good area for a reversal. The signals are aligning - EW,Cycles,TD sequential, indicators... well let's see if this time all this will materialize into a pullback.
TECHNICAL PICTURE
Short term - here the two scenarios - the wedge(red) looks better as a pattern, the reversal(green) looks more promising from TA stand point.

Intermediate term - waiting for the correction.... we will see if I am right.

- Momentum Histogram/RSI - Momentum ticked lower with another histogram divergence. Short term trend reversal is possible.
Long term - we have reached the point where the price should decide to follow the pattern, as for the last 6 months, or it will negate it and go parabolic.

- Momentum Histogram/RSI - momentum is up, the intermediate term trend is up.
MARKET BREADTH INDICATORS
The Market Breadth Indicators - nothing changed....
McClellan Oscillator - another lower high and divergence is coming.
McClellan Summation Index - trying to generate buy signal... the next divergence.
Weekly Stochastic of the Summation Index - sell signal.
Bullish Percentage - buy signal, do not get exited:)
Percent of Stocks above MA50 - yet another divergence... new ATH and another lower peak.
Fear Indicator VXO - BB even more narrow... expect explosive move in some direction. And strong candle on Friday, pullback has begun??
Advance-Decline Issues - expect another lower high and divergence of a bigger degree.
Put to call ratio - making several lower highs.
HURST CYCLES
The top of the 40 day cycle is already long overdue....

At week 54 of the 18 month cycle. It has reached size and length where we should see the top of the cycle. Now it should be only downhill for the next 4 to 7 weeks... come on mother nature you are stronger than the FED:)

Tom Demark SEQUENTIAL AND COUNTDOWN - this technique spots areas of exhaustion.
Countdown could finish with 13 making just higher high(green short term top is in) or we will see one last surge(red scenario wave 5) to finish the countdown.
The rules are not exact in this case - no edge here. The message is we are near to a top.

Nov 29, 2013
Blow off phase?
I think we are witnessing stock mania again after 2000 and 2007. It starts looking like a blow off move...the last correction was a year ago, percent bears at extreme low and moving down, Mom and Pop buying mutual fonds again with both hands. The problem with such moves is, that you do not know, when they will end. All we know is that they end bad... always.
Zerohedge - Best run since 2004 eight green weeks in a row..
Business Insider - Margin debt at record high...
Zerohedge - Bears endangered species... mid-November were 15% now touching 14%, this are extreme levels.
 Solarcycles blog - 15th straight week of inflows to EU equity funds - best run in 11 years.....
 Solarcycles blog - parabolic again...


Nov 28, 2013
EW charts
And when I am on the EW "wave" here are some charts - food for thought... if you do not like turkey:)
Ok the first chart sums up the counts which I found in Internet. There is variations in the waves of smaller degree, but I am focusing on the big picture.
- the bearish one W-X-Y(red) - not very popular as you can expect. Daneric / Wavepatterntraders.com
- bearish but with expected more upside A-B-C green wavetrack.com / Wavepatterntraders.com
- the bullish one impulse 1-2-3-4-5 - Tony Caldaro/PUG the most prominent I think.
My comment - take a step back and look at the big picture, forget about all the bull/bear fight, forget about the relentless move up and up and up....
What I see is a three wave structure 2009-2011 and even on a bigger degree another three wave structure huge moves 2009-2011 and 2011-2013 divided with
sharp correction in the middle. The two surges has almost the same size and length. According two the EW rules three wave structures are corrective....
Today Wavepatterntraders.com posted the same what I am thinking for a while.
This means the count should be W-X-Y. We have not confirmation for reversal so the second surge 2011-2013 could extend further or the A-B-C count.
I am just trying to look at the waves without emotions and I ask my self - why should I discard the count which fits the best - good shape,good proportions?
The only argument is sentiment - no one wants to believe in something bearish after 5 years and SP500 has tripled.
Now the bulls will kill me:)) You can forget trying to discuss counts with the bulls - you are a moron,idiot,doomer, Prechter follower aka moron:),lost all your
money shorting aka stupid bear, etc. it goes on and on.... It is all about sentiment. I am sure, if 99% of them, see this move on... say 15 min chart will say 3 wave correction
but this one is running for almost 5 years and getting parabolic so it "must be" an impulse what else....
I am curious how the bulls will count the DAX the second chart. Impulse on the DAX is pure fantasy, "creative counting" as I call it, count to fit my sentiment not the market....
Now instead fighting with the bulls or the bears,wasting your energy, we should try to be practical - you do not get paid to be the "smart ass" who nailed the top, the market will pay you
if you have the right trading plan and follow it. Here are the scenarios:
- the bearish scenario - in this case we should see an important top. Even if this is true, the price is way too far from MA50 on the weekly chart and the first move lower will finish around
this levels 1600-1650 and it will be bought. There will be an subsequent rally to test the top. See the last chart how the top usually develops or this post
Is-it-different-this-time
- the other two scenarios - for the intermediate term they are the same, but one says this is impulse wave C the other says this is impulse wave 3, after all it is the same impulse.
In this case the correction will be just a wave 4 with the same target as above and than here it comes the next rally ~2200. It is logical to see a sharp
correction because greed should be purged(the herd has to be scared) before the rally continue higher. That is the way it works.
So for the intermediate term the next 3-4 months all counts see a correction and move back to the top. Here is my plan:
- getting long now is too late for me - the SPX500 could move 20-50 points higher but with downside risk 150-200 points risk/reward looks awful
- take partial profits if you see a spike higher and/or a move bellow 1800. Close longs and open shorts below 1775
- ride a correction lower to 1630-1600
- ride the subsequent move higher
- take half of the profits near the previous top
- wait to see what happens - add more longs after breakout(bullish scenario)/sell longs and go short(bearish scenario)

 I showed similar chart two months ago I think comparing the DJ 2000 top and the current action - the similarity continue and the next move should be a sharp decline.


Nov 27, 2013
Charts...
Ok it is boring the market action and I was going through the charts and this one is interesting. High yield corporate bonds track SP500 very closely...
do not ask me why. I am a chart guy I have no clue about fundamentals:)
Such "proxy" charts which follow closely the indexes can be used to adjust EW count,Cycle count etc. because they diverge a little bit
and give you slightly different picture of the move.
I am not an EW expert, but it can not be easier:) almost perfect impulse with almost perfect proportions. The chart says we are nearing the end of wave 5
of a monster impulse lasting more than 2 years. The first target for wave 5 was reached 61,8% of wave 1... hmmmm it can extend to same size as wave 1, that is possible. Lets take close look of this wave 5 - next chart.
 You have everything what you expect to see for a last wave - weak,chopy,divergence,falling volume, target for wave 5 reached.
It looks like ending diagonal (the one from yesterday is much smaller only for the last red line 5 of 5). It counts better as a diagonal because
all moves a threes. The wave from the August low is a little bit ugly for a wave 3. With the correction in the middle it counts better as a-b-c with subsequent 4 and 5.
If this is the right count a significant top is around the corner, if I am wrong there is wave 4 and 5 of 5 missing.
You have everything what you expect to see for a last wave - weak,chopy,divergence,falling volume, target for wave 5 reached.
It looks like ending diagonal (the one from yesterday is much smaller only for the last red line 5 of 5). It counts better as a diagonal because
all moves a threes. The wave from the August low is a little bit ugly for a wave 3. With the correction in the middle it counts better as a-b-c with subsequent 4 and 5.
If this is the right count a significant top is around the corner, if I am wrong there is wave 4 and 5 of 5 missing.
 Conclusion: The proxy chart says significant top is around the corner, alternate scenario pullback(wave 4) and then the final top. You will see the
difference - if the top is in, the indexes will start falling like a rock.
Conclusion: The proxy chart says significant top is around the corner, alternate scenario pullback(wave 4) and then the final top. You will see the
difference - if the top is in, the indexes will start falling like a rock.


Nov 26, 2013
Update
Boring week as expected.... it looks to me like an ending diagonal - 4 has just started and 5 to mark the top.


Nov 23, 2013
Weekly review
Short term view - flat week or the indexes will squeeze again several points higher.
Intermediate term view - nearing an intermediate term top.
Ok this past week I was expecting a pullback,another high and topping to begin. Well I was wrong - the pullback was deeper and lasted longer than expected and there were no time for topping:). With the short trading week and the holidays I do not expect huge moves up or down. I expect now the indexes to continue their work on ATH and the topping not to forget:)
Nothing changed this week, the indexes have squeezed several points higher. I still think that the next intermediate term move will be a correction, and again dance with the bulls until the music plays, but stay near the exits.
Short term we will see higher prices, probably SP500 will reach its target 1810-1815.
TECHNICAL PICTURE
Short term - I have no idea for the exact path. Up to the trend line and pullback, or in reverse order pullback and up to the trend line.....
 - Triple cross(EMA10 and EMA20 crossing EMA50) - short term trend up.
Intermediate term - waiting for the correction.... we will see if I am right.
 - Trend direction EMA50/MACD - the intermediate term trend is up, but we are seeing MACD divergence.
- Momentum Histogram/RSI - momentum is up,but not really strong. I expect to see another histogram divergence.
Long term - we have reached the point where the price should decide to follow the pattern, as for the last 6 months, or it will negate it and go parabolic.
 - Trend direction EMA50/MACD - long term trend is up - the price above MA50 and MACD above zero. Watch out for the MACD divergence.
- Momentum Histogram/RSI - momentum has turned up, the intermediate term trend is up.
MARKET BREADTH INDICATORS
The Market Breadth Indicators - they do not inspire me to be bullish, even with ATH after ATH....
McClellan Oscillator - another lower high and divergence is coming.
McClellan Summation Index - sell signal, we see a divergence for the short term - new ATH not even a buy signal.
Weekly Stochastic of the Summation Index - sell signal..
Bullish Percentage - buy signal, do not get exited:)
Percent of Stocks above MA50 - yet another divergence... new ATH and another lower peak.
Fear Indicator VXO - very narrow BB, which means expect explosive move in some direction... do you think it will be to the downside??? For the whole year 2013 this levels were a bottom.
Advance-Decline Issues - expect another lower high and divergence of a bigger degree.
Put/Call ratio - making several lower highs.
Percent of Stocks above MA200 - do not keep up with the indexes.
HURST CYCLES
The 40 day is now really extended... The longest one, for this 18 month cycle, lasted 32TD and this one is already 33TD long. I must admit, I was not expecting such strong move in the last 20 week cycle of the 18 month cycle.

At week 53 of the 18 month cycle. It has reached size and length where we should see the top of the cycle. Now it should be only downhill for the next 7 to 9 weeks...

Tom Demark SEQUENTIAL AND COUNTDOWN - this technique spots areas of exhaustion.
Currently we have 11 of a countdown and I expect to see the 13 next week.

Intermediate term view - nearing an intermediate term top.
Ok this past week I was expecting a pullback,another high and topping to begin. Well I was wrong - the pullback was deeper and lasted longer than expected and there were no time for topping:). With the short trading week and the holidays I do not expect huge moves up or down. I expect now the indexes to continue their work on ATH and the topping not to forget:)
Nothing changed this week, the indexes have squeezed several points higher. I still think that the next intermediate term move will be a correction, and again dance with the bulls until the music plays, but stay near the exits.
Short term we will see higher prices, probably SP500 will reach its target 1810-1815.
TECHNICAL PICTURE
Short term - I have no idea for the exact path. Up to the trend line and pullback, or in reverse order pullback and up to the trend line.....

Intermediate term - waiting for the correction.... we will see if I am right.

- Momentum Histogram/RSI - momentum is up,but not really strong. I expect to see another histogram divergence.
Long term - we have reached the point where the price should decide to follow the pattern, as for the last 6 months, or it will negate it and go parabolic.

- Momentum Histogram/RSI - momentum has turned up, the intermediate term trend is up.
MARKET BREADTH INDICATORS
The Market Breadth Indicators - they do not inspire me to be bullish, even with ATH after ATH....
McClellan Oscillator - another lower high and divergence is coming.
McClellan Summation Index - sell signal, we see a divergence for the short term - new ATH not even a buy signal.
Weekly Stochastic of the Summation Index - sell signal..
Bullish Percentage - buy signal, do not get exited:)
Percent of Stocks above MA50 - yet another divergence... new ATH and another lower peak.
Fear Indicator VXO - very narrow BB, which means expect explosive move in some direction... do you think it will be to the downside??? For the whole year 2013 this levels were a bottom.
Advance-Decline Issues - expect another lower high and divergence of a bigger degree.
Put/Call ratio - making several lower highs.
Percent of Stocks above MA200 - do not keep up with the indexes.
HURST CYCLES
The 40 day is now really extended... The longest one, for this 18 month cycle, lasted 32TD and this one is already 33TD long. I must admit, I was not expecting such strong move in the last 20 week cycle of the 18 month cycle.

At week 53 of the 18 month cycle. It has reached size and length where we should see the top of the cycle. Now it should be only downhill for the next 7 to 9 weeks...

Tom Demark SEQUENTIAL AND COUNTDOWN - this technique spots areas of exhaustion.
Currently we have 11 of a countdown and I expect to see the 13 next week.

Subscribe to:
Posts (Atom)
