Mar 25, 2023

Weekly preview

Desptite all the talk about failed banks the market follows the expected path and seems not to care. The pattern looks like b/b/B - short said one big nothing. In a week or two when the next decline starts we will see if there is something more beneath the surface.
The speed and size of the moves from different degrees since October.2022 point to corrective moves. The last two weeks despite all the fear have not changed anything. So the forecast has not changed.


TRADING
Trading trigger - buy signal.
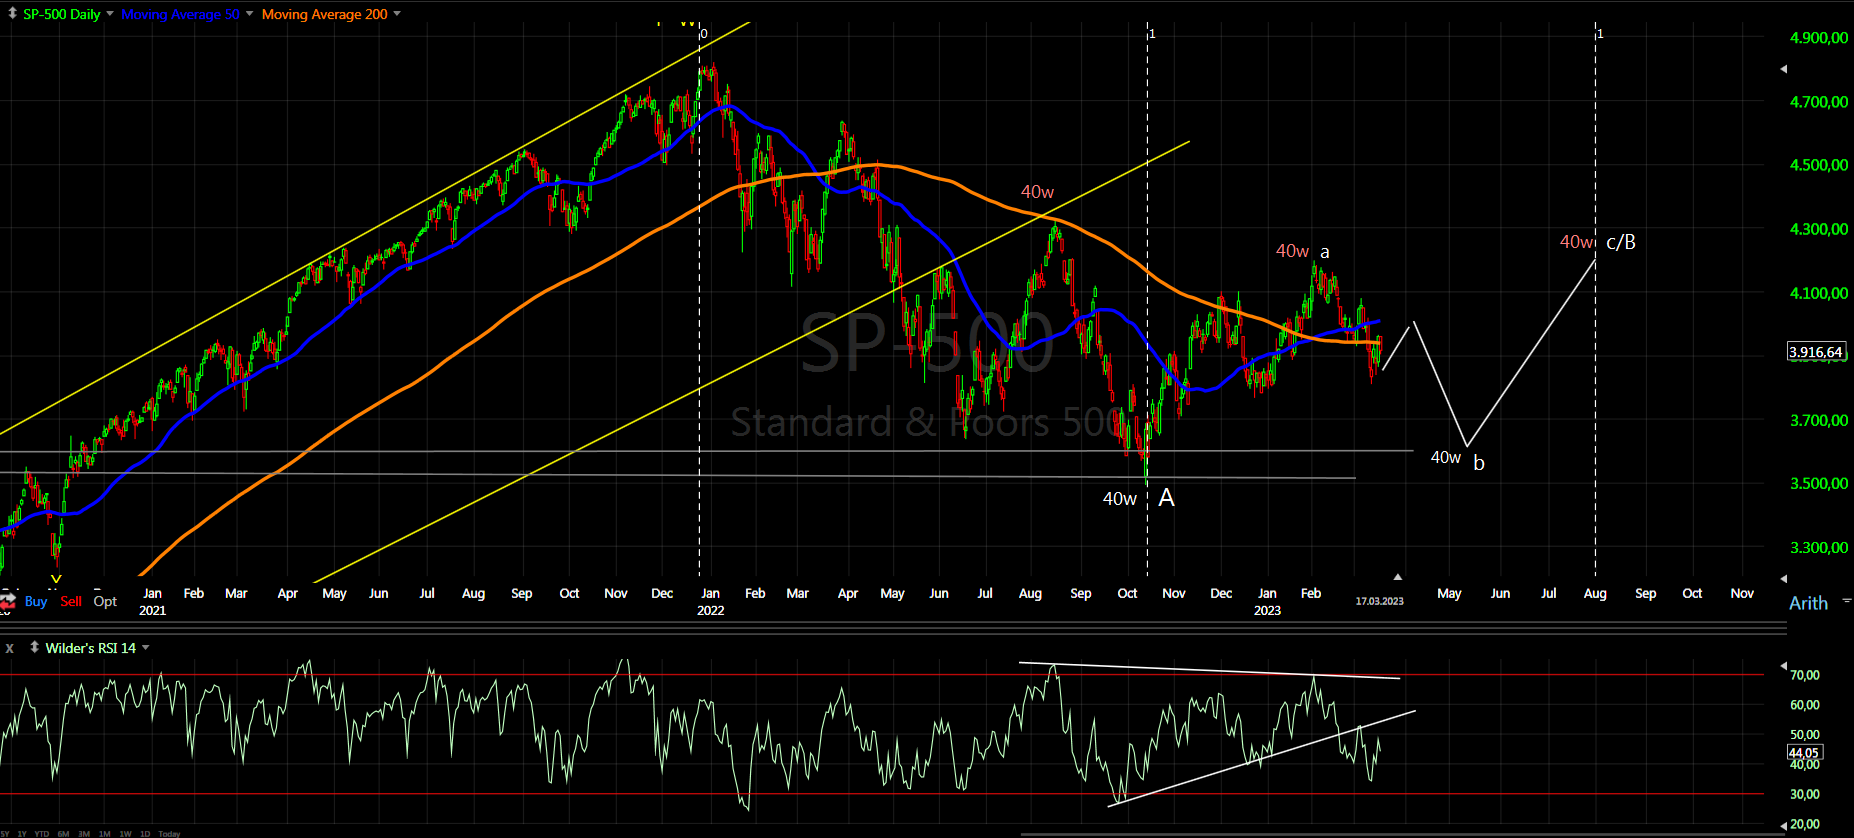
Analysis - long term sell the rips, we have major top. Intermediate term high in a week or two and lower for 5-7 weeks.

P.S. - for a trade both analysis and trigger should point in the same direction.


TECHNICAL PICTURE and ELLIOTT WAVES
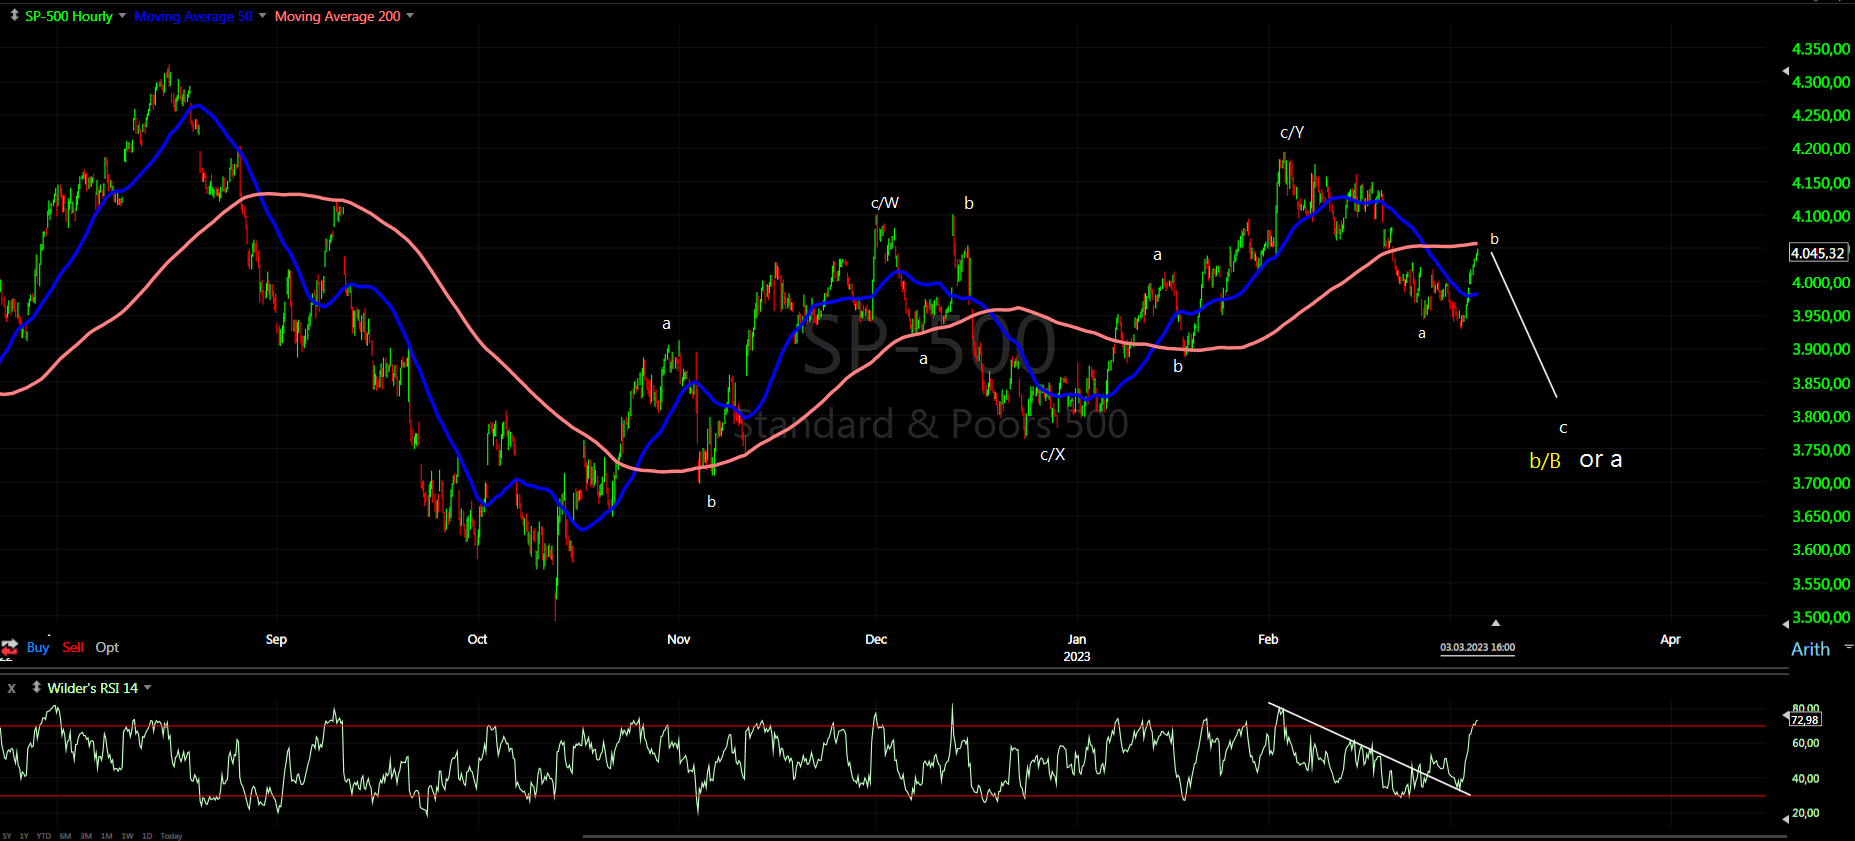
Short term - this seems to be the right pattern... now in the middle of the b-wave yellow.


Intermediate term - in the middle of wave b/B.


Long term - most likely huge double zig-zag from the 2009 low B-wave was completed and multi year decline has started. If we are lucky it is lower degree b-wave.


MARKET BREADTH INDICATORS
Market Breadth Indicators - trying to turn higher, but no reversal signs so far.
McClellan Oscillator - moving higher after very oversold level.
McClellan Summation Index - sell signal.
Weekly Stochastic of the Summation Index - sell signal, oversold level reached.
Bullish Percentage - turned up.
Percent of Stocks above MA50 - below 25.
Fear Indicator VIX - moving lower.
Advance-Decline Issues - bounce from oversold level.


HURST CYCLES
Short term cycles - 20d low expected and higher. The cycle is right translated so we should see one more high which should be 10w cycle high.


Difficult to stick to the theory counting 20w cycle - if we try I would say one short cycle with a low in December and now in the middle of extended 20w cycle.
I think we have 40w cycle consisting of three cycles - it looks much better.

Mar 18, 2023

Weekly preview

Bounce higher as expected - the 20d high, next week we should see decline into 20d low... maybe the indices turned higher for the 10w cycle high currently at week 6. If we see weak decline next week than this is the case.
Intermediate term - main scenario wave b/B running. Other possible scenarios:
- wave B is completed - this move lower is too slow - we have 5 weeks up and 6 weeks lower which could not take out the previous low plus oversold indicators. So very low probability.
- fear VIX 30, oversold market breadth indicators, headlines and talk about failed banks. So maybe the indices are close to the low for b/B not in the middle of it. The chart for this option is shown below, DJI is good example because it made lower high in January. This is a plausible option.


TRADING
Trading trigger - sell signal.
Analysis - long term sell the rips, we have major top. Intermediate term - pause for a week and lower for two months.

P.S. - for a trade both analysis and trigger should point in the same direction.


TECHNICAL PICTURE and ELLIOTT WAVES
Short term - two legs lower with the same size and zig-zag higher... is there more to the upside for 10w high?... maybe FOMC is a high or continuation lower next week and final flush lower... it is not possible to say at the moment.
For now sticking to the initial plan shown on the chart.


Intermediate term - in the middle of wave b/B.


Intermediate term - b/B completing with long 20w cycle followed by long cycle for the 20w high.


MARKET BREADTH INDICATORS
Market Breadth Indicators - at oversold levels, trying to turn higher, but no reversal signs so far.
McClellan Oscillator - bounce higher from very oversold level.
McClellan Summation Index - sell signal.
Weekly Stochastic of the Summation Index - sell signal.
Bullish Percentage - at the oversold level.
Percent of Stocks above MA50 - below 25.
Fear Indicator VIX - hit 30 and retracing.
Advance-Decline Issues - oversold level.


HURST CYCLES
Short term cycles - close to 20d high, next is decline into 20d low.
Intermediate term possible 10w low and now higher into 10w high.


Possible 20w cycle low or final flush lower next week. Watching the price action next week for further clues. I think we have 40w cycle consisting of three cycles - it looks more and more likely.
Here is how I see the DAX

Mar 11, 2023

Weekly preview

The new low is not a surprise - we saw 5w high and now heading lower into intermediate term low. The best explanation I have is the indices are in the middle of b/B and the 40w cycle consists of three cycles. This is shown on the daily chart, this is what makes sense.
Why?
- pattern - because the move lower is slow so it is of the same degree as the previous up move which means we are still in the same pattern and not a reversal.
- cycles - five weeks lower at week 14 this does not fit with expected 20w high... something else is going on.


TRADING
Trading trigger - sell signal.
Analysis - long term sell the rips, we have major top. Intermediate term - bounce soon and lower for two months.

P.S. - for a trade both analysis and trigger should point in the same direction.


TECHNICAL PICTURE and ELLIOTT WAVES
Short term - in the second zig-zag of a double zig-zag. We should see bottoming and bounce higher.


Intermediate term - what makes sense is shown on the chart - two legs with the same length and the cycles accordingly.


Long term - most likely huge double zig-zag from the 2009 low B-wave was completed and multi year decline has started. If we are lucky it is lower degree b-wave.


MARKET BREADTH INDICATORS
Market Breadth Indicators - pointing lower, but nearing the moment for a bounce.
McClellan Oscillator - very oversold level.
McClellan Summation Index - sell signal.
Weekly Stochastic of the Summation Index - sell signal.
Bullish Percentage - pointing lower.
Percent of Stocks above MA50 - oversold level.
Fear Indicator VIX - spike higher.
Advance-Decline Issues - doing nothing right above the oversold level.


HURST CYCLES
Short term cycles - this should be 20d low and we should see bounce higher next week for 20d high.
What if the first 20w cycle was short and now the indices are in the middle of the longer 20w cycle...


Week 21, 40w cycle consisting of three cycles looks more and more likely.
The previous 4y cycle high consists of two cycles instead of 3x18m cycles. With the pattern shown on the daily chart this will repeate. This is the reason I am not showing 18m high.

Mar 5, 2023

Weekly preview

Something higher was expected for 5w high and we have it. Given the strength and the expcted 20w low it looks clear the low should be in... not so fast there is no any technical damage and the pattern looks like expanded flat b-wave at 5w high.
At the moment there is no way to make a difference confirmed with some evidence, the two options:
- the 20w low is in, there is no clear 5w high like the previous 10w cycle high(December/January) the price continues higher 3-4 weeks for 20w/18m high.
- this is 5w high and final decline into 20w low follows like September last year.

Just waiting to see what happens next week, if we do not see reversal lower than we have 20w low.


TRADING
Trading trigger - buy signal.
Analysis - long term sell the rips, we have major top. Intermediate term - no clear direction at the moment.

P.S. - for a trade both analysis and trigger should point in the same direction.


TECHNICAL PICTURE and ELLIOTT WAVES
Short term - pattern is not very clear... it looks like b-wave to me, but I can not confirm it.


Intermediate term - waiting a few weeks for more clarity.... the B-wave is completed or the indices are in wave b/B.


Long term - most likely huge double zig-zag from the 2009 low B-wave was completed and multi year decline has started. If we are lucky it is lower degree b-wave.


MARKET BREADTH INDICATORS
Market Breadth Indicators - oscillators turning higher, next week will confirm low or not.
McClellan Oscillator - retracing higher after oversold level.
McClellan Summation Index - sell signal.
Weekly Stochastic of the Summation Index - sell signal.
Bullish Percentage - turned higher, in the middle of the range.
Percent of Stocks above MA50 - turned higher, in the middle of the range.
Fear Indicator VIX - retracing lower.
Advance-Decline Issues - turned higher.


HURST CYCLES
Short term cycles - this should be 5w high followed by final decline for 20w cycle low, but if you look the previous 10w cycle there is no 5w high so the price could just continue higher for the 20w high, no way to say at the moment... at least I do not know how to make a difference.


Week 20 for the 20w cycle and possible low. Week 13 for the 20w cycle high.
This is the cycle model with 18m low in October if the B-wave started from this low.