Trading trigger - buy signal.
Analysis - final wave completing the correction and turn lower to complete the 4y cycle low. At intermediate term high now topping process during the holidays.
P.S. - for a trade both analysis and trigger should point in the same direction.

TECHNICAL PICTURE and ELLIOTT WAVES
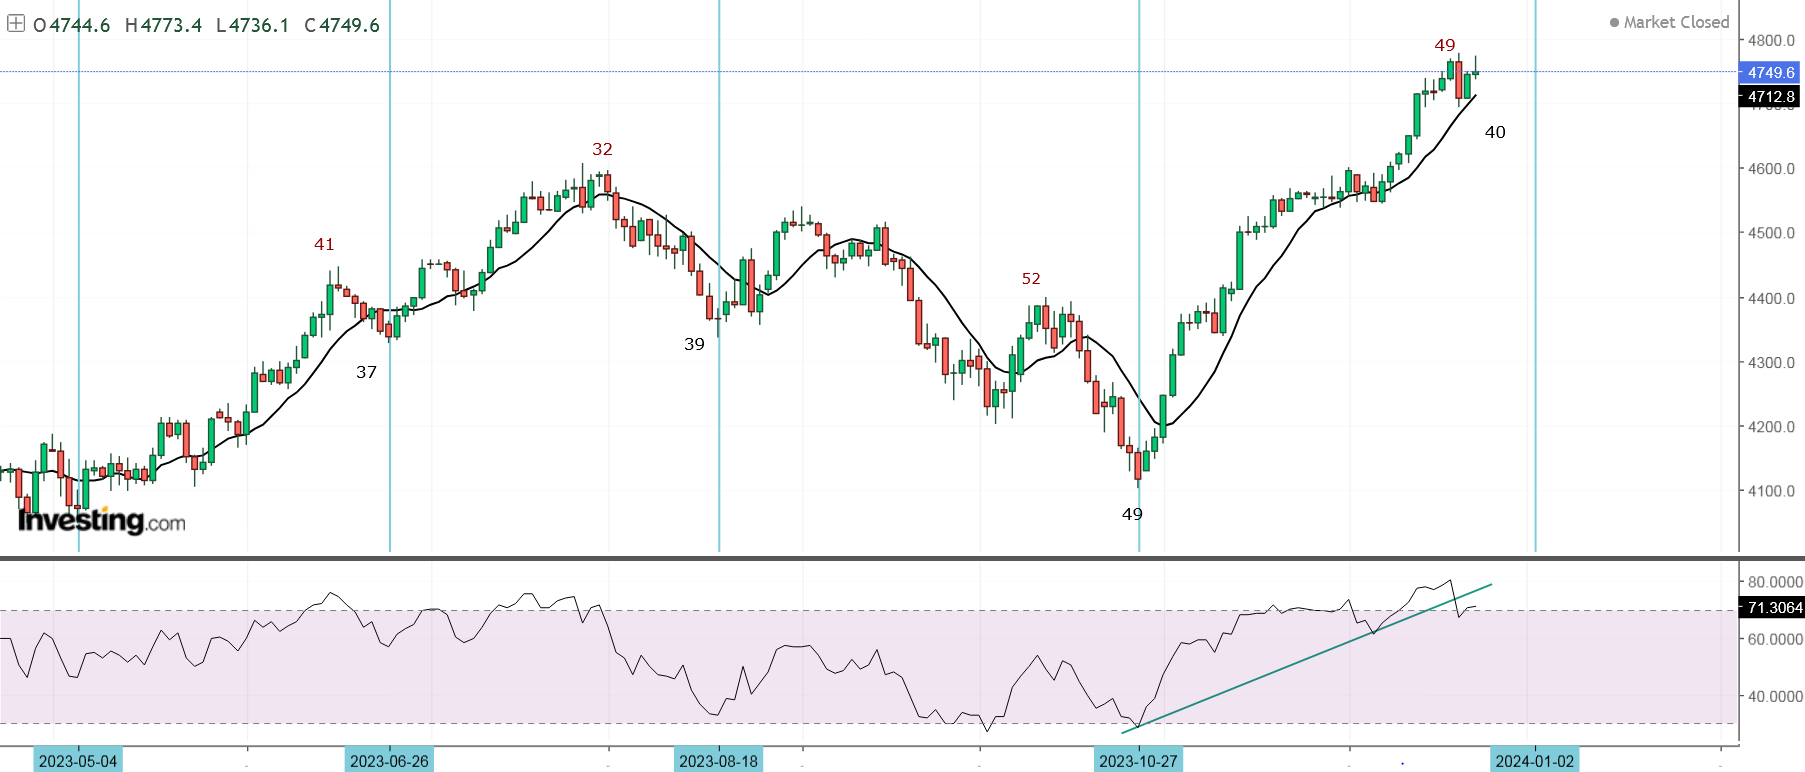
Short term - it looks like another double zig-zag and I suspect the high was two weeks ago.

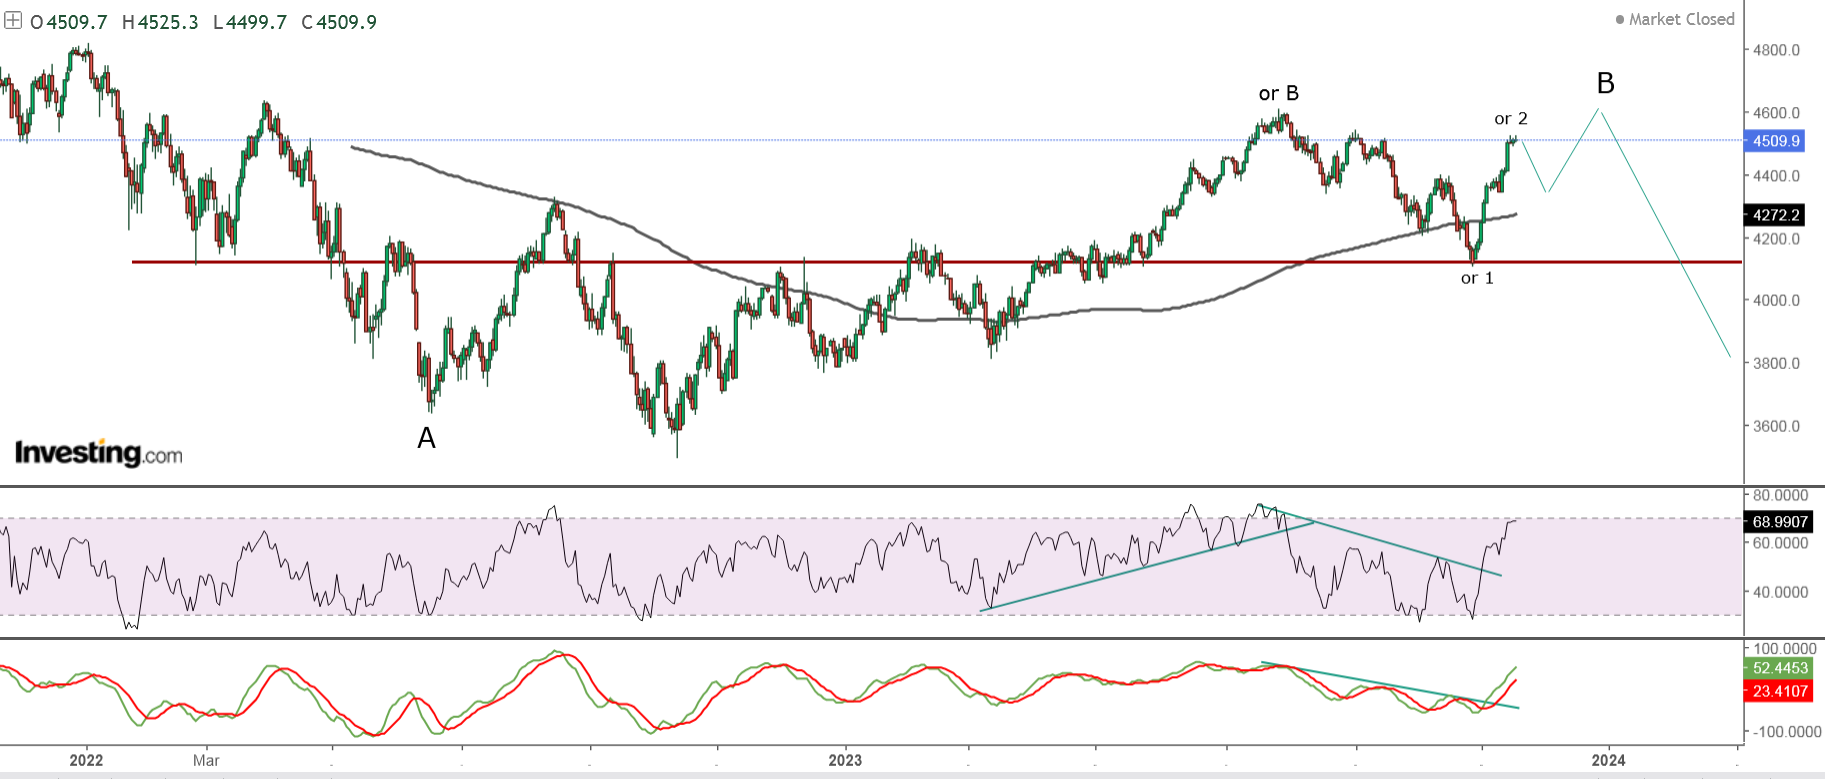
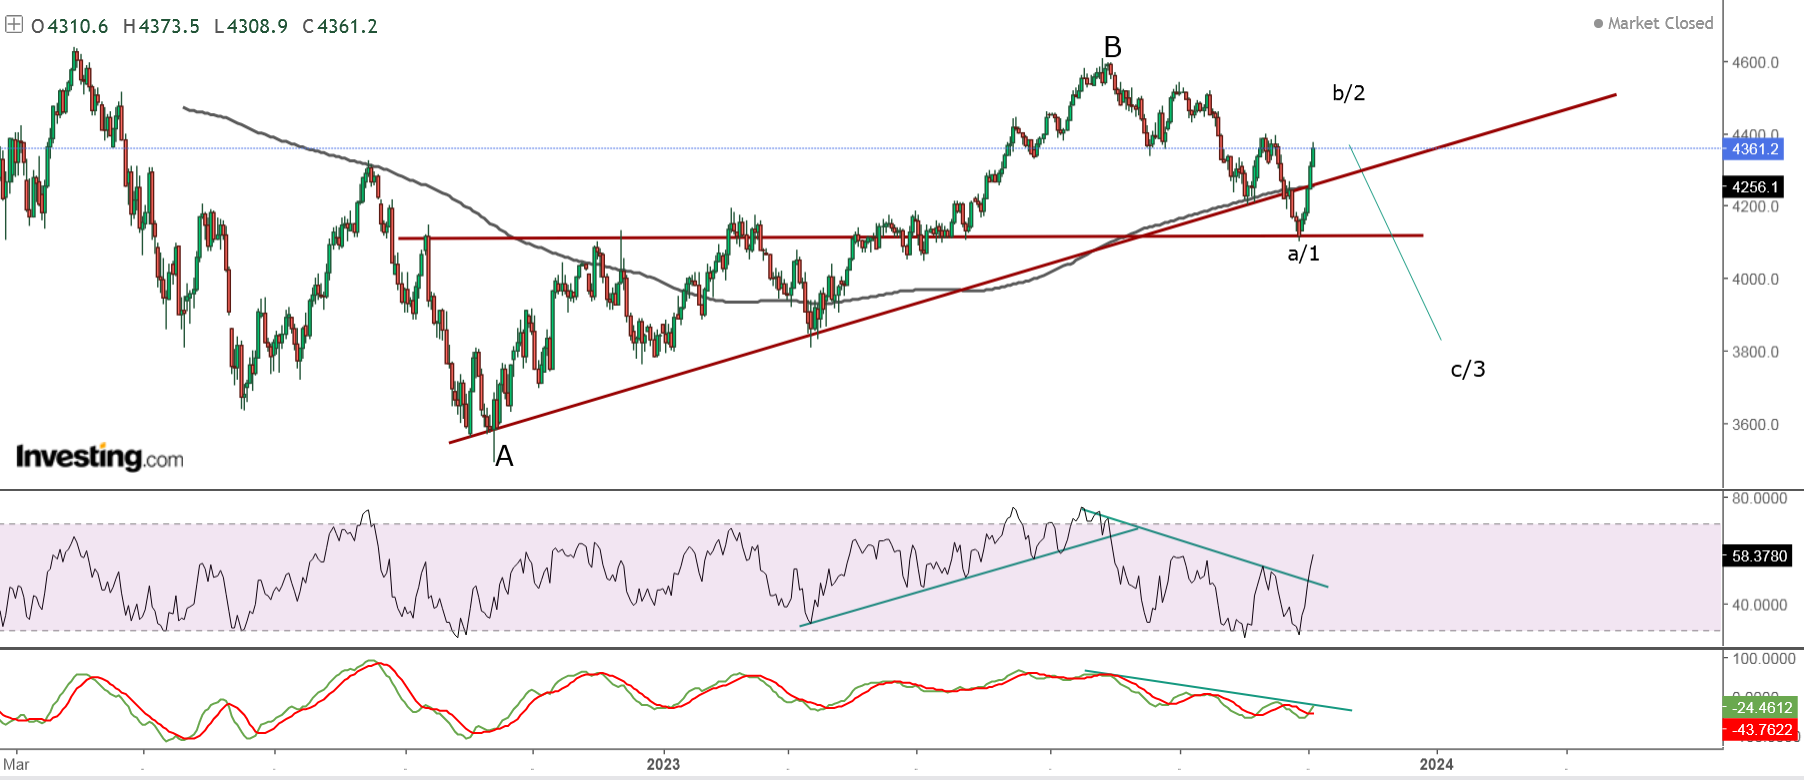
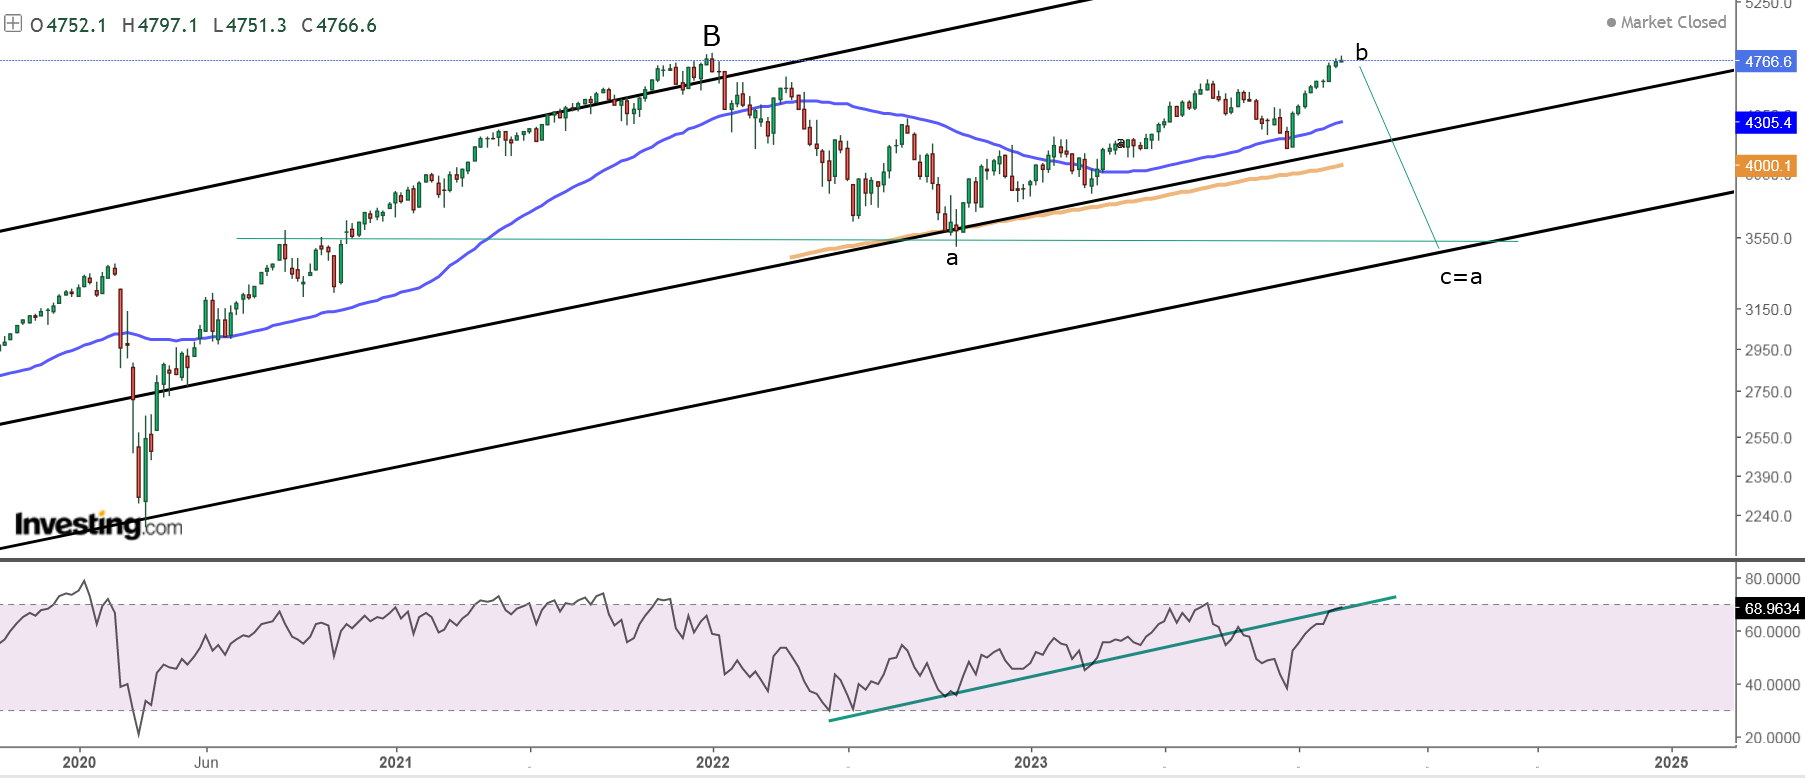
Intermediate term - two zig-zags down and up with the same size... next should be decline probably C-wave for a flat.

Long term - 4y cycle high the end of 2021, now a-b-c lower into 4y cycle low in Q1 2024. Very long term - most likely huge double zig-zag from the 2009 low.If we are lucky this is some topping pattern triangle or ED and there is one more high. If not multi year decline has started.
MARKET BREADTH INDICATORS
Market Breadth Indicators - extremely overbought.
McClellan Oscillator - multiple divergences.
McClellan Summation Index - extremely overbought.
Weekly Stochastic of the Summation Index - buy signal.
Bullish Percentage - extremely overbought.
Percent of Stocks above MA50 - extremely overbought.
Advance-Decline Issues - touched overbought and turned lower.
Fear Indicator VIX - short term divergence.
HURST CYCLES
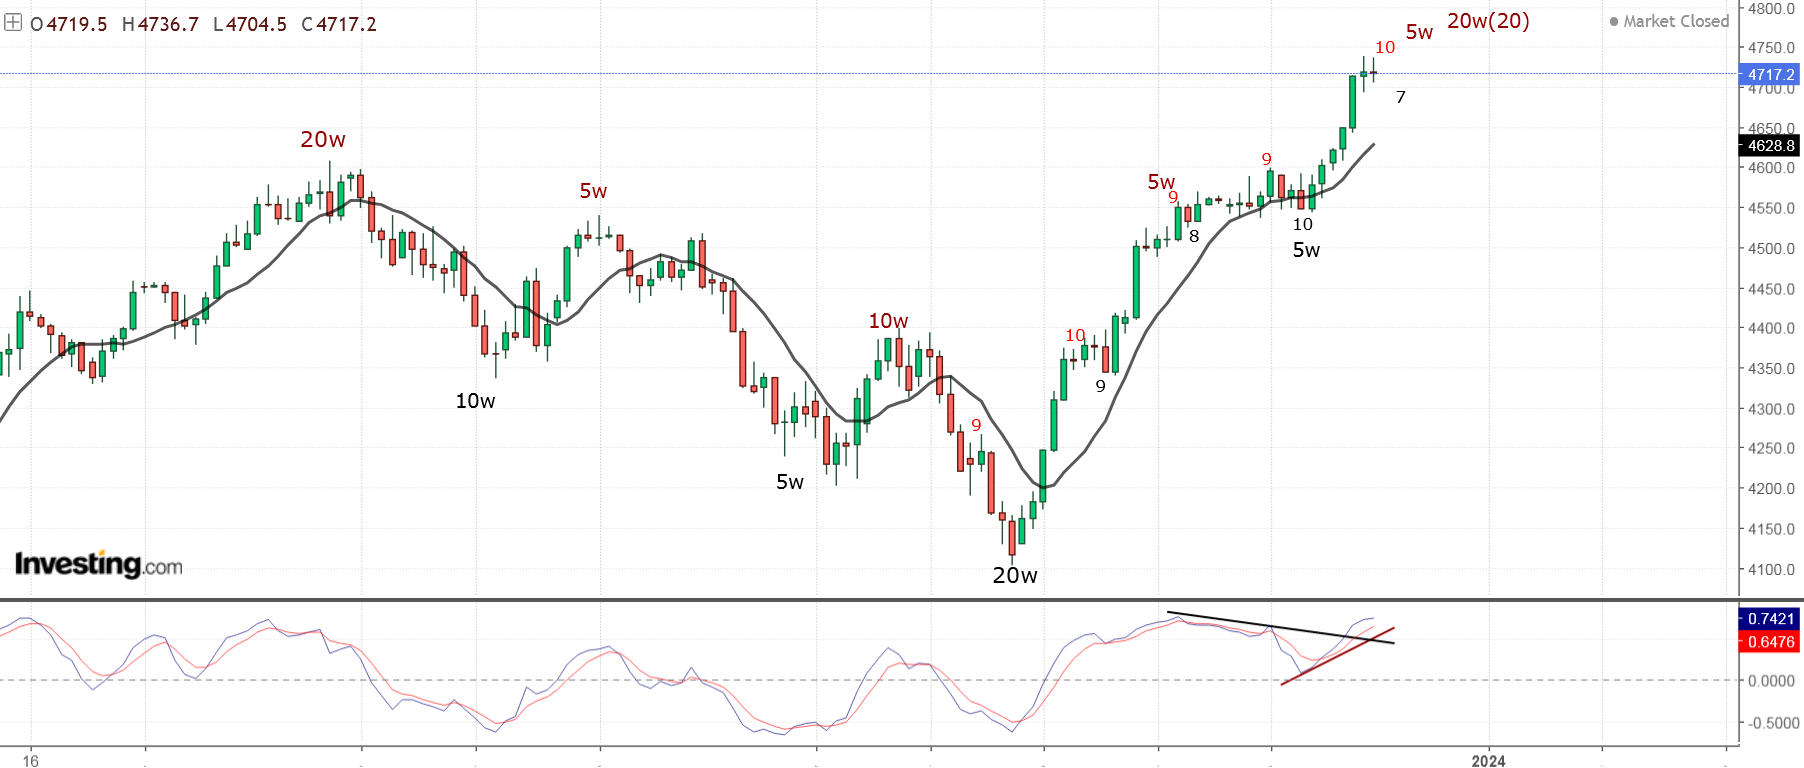
Short term cycles - after 20d low the indices are at 20d high. This is the third 20d cycle for extended 5w cycle high and this is the fourth extended 5w cycle for extended 20w cycle high.
I have the suspicion the 20w high was earlier, it could be confirmed when we see the next 5w high.

Week 9 for the 20w cycle. Rising into 20w cycle high currently at week 22 discussed above.
Long term the previous 4y cycle high is repeating - 3x40w cycles/two years for mid-cycle high(2018-2019 / 2022-2023) and down into 4y low.
From the October.2022 low the cycles do not follow the theoretical model.
The highs - we have one 40w high and one 18m high consisting of 3x20w extended cycles instead of 2x40w, but the same average length 15-16 months.
The lows - we have 20w and 40w cycle, I guess one more 20w cycle(the current one) to complete 18m/4y cycle.