Trading trigger - buy signal.
Analysis - final wave completing the correction and turn lower to complete the 4y cycle low. At intermediate term high now topping process during the holidays.
P.S. - for a trade both analysis and trigger should point in the same direction.

TECHNICAL PICTURE and ELLIOTT WAVES
Short term - it looks like another double zig-zag and I suspect the high was two weeks ago.

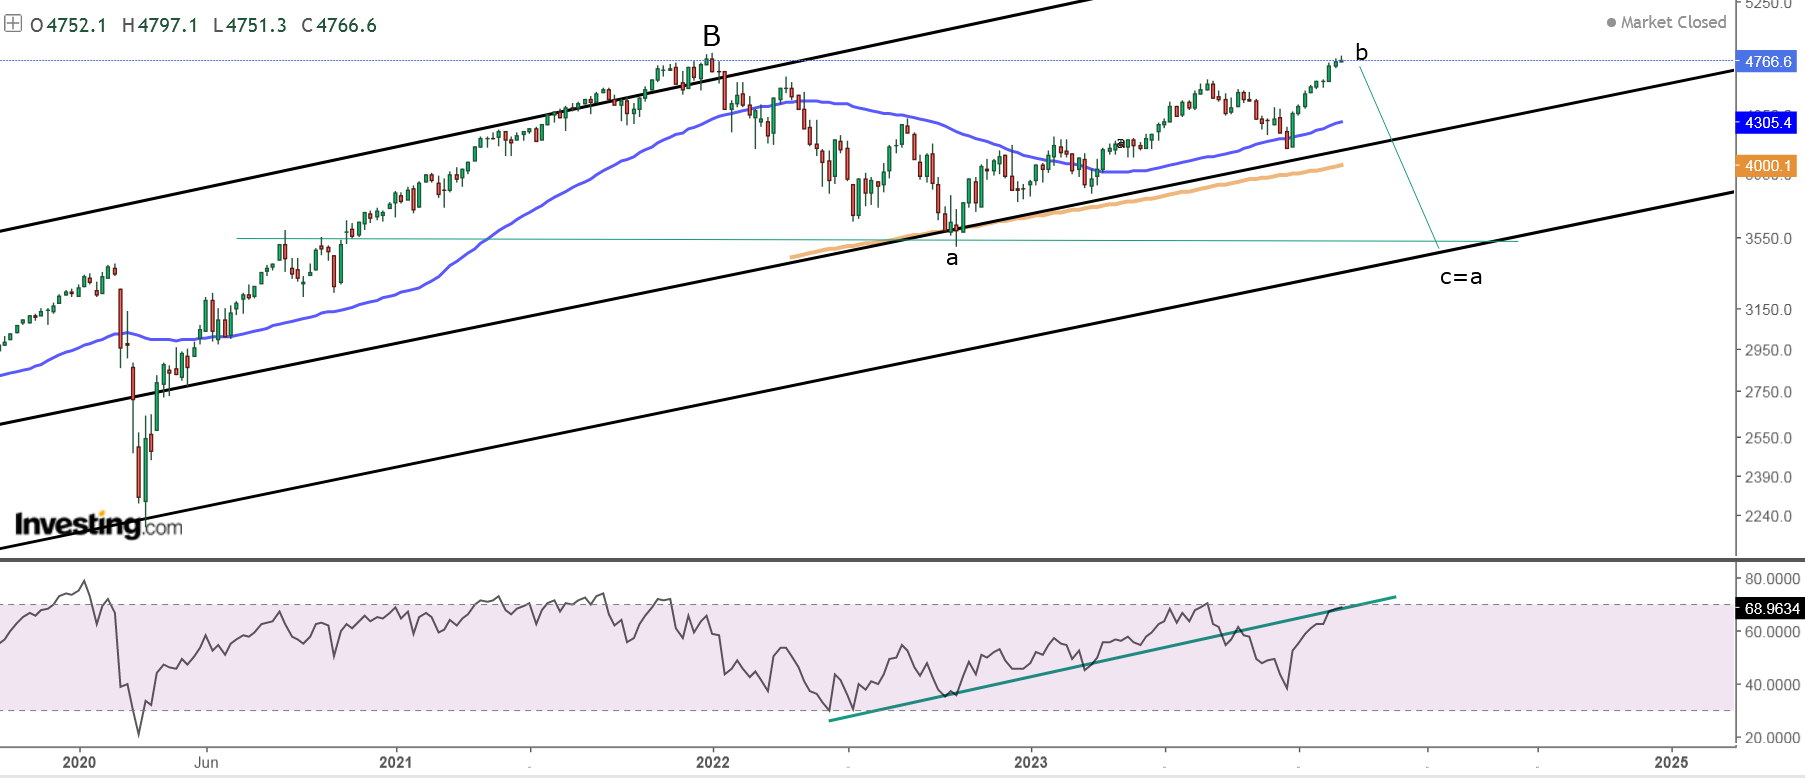
Intermediate term - two zig-zags down and up with the same size... next should be decline probably C-wave for a flat.

Long term - 4y cycle high the end of 2021, now a-b-c lower into 4y cycle low in Q1 2024. Very long term - most likely huge double zig-zag from the 2009 low.If we are lucky this is some topping pattern triangle or ED and there is one more high. If not multi year decline has started.
MARKET BREADTH INDICATORS
Market Breadth Indicators - extremely overbought.
McClellan Oscillator - multiple divergences.
McClellan Summation Index - extremely overbought.
Weekly Stochastic of the Summation Index - buy signal.
Bullish Percentage - extremely overbought.
Percent of Stocks above MA50 - extremely overbought.
Advance-Decline Issues - touched overbought and turned lower.
Fear Indicator VIX - short term divergence.
HURST CYCLES
Short term cycles - after 20d low the indices are at 20d high. This is the third 20d cycle for extended 5w cycle high and this is the fourth extended 5w cycle for extended 20w cycle high.
I have the suspicion the 20w high was earlier, it could be confirmed when we see the next 5w high.

Week 9 for the 20w cycle. Rising into 20w cycle high currently at week 22 discussed above.
Long term the previous 4y cycle high is repeating - 3x40w cycles/two years for mid-cycle high(2018-2019 / 2022-2023) and down into 4y low.
From the October.2022 low the cycles do not follow the theoretical model.
The highs - we have one 40w high and one 18m high consisting of 3x20w extended cycles instead of 2x40w, but the same average length 15-16 months.
The lows - we have 20w and 40w cycle, I guess one more 20w cycle(the current one) to complete 18m/4y cycle.


thanks Krasi, happy new year to you and your family. Thank you for your posts every weekend. When you say it's maybe a larger triangle - so this would be a larger B of said triangle and then C this year, then D next year etc? thank you.....
ReplyDeleteTriangle/ED is the alternative pattern now wave c/3 top with d/4 to follow - this is the case if the pattern from 2009 is not completed.
DeleteThe flat I am forecasting is sideways pattern too so I still think it is more likely.
The idea is this is not a trending market - this is the message from market breadth.
Happy new year from Rome
ReplyDeleteHappy new year
ReplyDeletehappy new year krasi. i think this may end up into an ED starting on dec 21. we completed waveA and probably on tuesday (if not already in last friday) waveB. we could have another 5-9 days to complete wave C D & E before we top.
ReplyDeleteJP
So, wave d/4 is to 👇 then one more ATH?
ReplyDeletewave E would be the top in the next 5-9 days
ReplyDeleteJP
of course if the dec 21 low is taken out the ED scenario is dead
DeleteJP
I don't understand the ED, just by graphing
ReplyDeleteI think there's no time for a decline of 30% for February-March, most likely for June being last October 40w low
ReplyDeleteMaybe we will see.
DeleteWhen you say "it could be confirmed when we see the next 5w high", do you mean we can see a new high exceeding the previous 20w high?
ReplyDeleteI mean 20w high earlier in December in this case the next 5w high should occur earlier around mid-January.
DeleteHappy new year.
ReplyDeleteI wish you much luck in 2024 and success in trading:)
Example for "I suspect big sideways pattern" - DAX with possible ED - https://invst.ly/12ut82
ReplyDeleteFrom the 2020 low we have three corrective moves with very good Fibo measurements.
Accordingly the cycle is "adjusting" for the pattern - the 4y cycle high and low divides good in two instead of three.
For the US indices DJI has similar pattern, maybe NDX too with 62% retracement and slightly higher high.
SPX/NYSE with 50% retracement and lower high so far... still could be some kind of wedge.
And example how this fits in the big picture using NDX - https://invst.ly/12utq8
DeleteA-B-C with impulse A and ending diagonal C-wave.
And from 2000 expanding flat or triangle - https://invst.ly/12utve
Deletethis is serious depression type of decline? when will it begin?
DeleteYes, the era of free money is over and the bill will be paid.
DeleteIt should start in 2025.
Do corrections usually go 2x higher than the previous ATH? Up to 2009, the SP never went above c.2000! Then it corrects to c.5000 from 2009 to 2023. How can this be a correction? Thanks
DeleteStrong does not mean impulse and when it is not impulse it is corrective pattern. Yes, corrective patterns can go higher above the previous high.
DeleteLook at the 2018-2020 correction and you will see how making higher high twice is corrective and ends with lower low. If you look closely this is exactly the same pattern like the shown 2000-2030.
I've never seen such an extreme example like this before
DeleteKrasi, why I can't open the dax example, never ever
ReplyDeleteTry different browser or clear the cache.
DeleteThanks krasi, it's open, very nice work
ReplyDeleteSo NDX is going to 2008 low?
ReplyDeleteDax could be a bigger ED, March 2020 wave 2, now wave 3 or even 5
ReplyDeleteThe triangle in SPX can not be, d lasts longer than a+b+c
ReplyDeleteNeely had a similar idea but d finishing earlier
I think it is not correct
Than it is expanding flat.
DeleteThey are going to cut rat so maybe go higher?
ReplyDeleteStudy the markets instead of reading mainstream bullshit.
DeleteWhat happened on previous occasion "cut rat"?
Krasi, what is your opinion on BTC? You were expecting a correction much earlier. Do you think it is disconnected from the traditional markets now?
ReplyDeleteCompare the charts and you will see 1:1 correlation. Did not you notice that the indices are higher too?
DeleteNo, the decline is not cancelled. No, crypto will not decouple.
Crypto is not different, it is not safe haven, just another tool to speculate.
After 2032 we can talk if they offer something different and their value until then it is plain and simple greed.
How do you predict these timelines so far out in the future? :) Why 2032?
DeleteThe difference is that Bitcoin decline started before SPX decline in 2022. Similarly it bottomed around 15K after that when SPX had not declined. So I get confused whenever you say there is 1:1 correlation. For BTC, it feels the 4 year low was the one around 15K.
Delete2032 is major shift out of stocks into commodities. Look at gold chart 1970-1980 2001-2011 up huge.... roughly 10 years higher and 20 years correction and stocks correcting 4/8/16/32 years gold cycles. The next date is 2031-2032. Gold/commodities are not the reason of course they are the symptom for something big happening.
DeleteThe correlation is not day by day... many indices made a high in November like bitcoin NDX for example and the low is a few weeks later. This is still 1:1 correlation.
DeleteAbout the cycles chart: there is no 18m high between the lows of March 2020 and June 2021 ?
ReplyDeleteIt is explained above - the previous and this 4y cycle high divide in two instead of three cycles.
DeleteBut then February 2020 should be 18m low and June 2021 only 40w low
ReplyDeleteNo idea why......
Deletethis low this morning should be the end of waveB of the rising ED. any further decline and the ED is probably dead.
ReplyDeleteJP
if we don't break this morning low, this low could be the 5week low which should be followed by new highs in the next week or two.
DeleteJP
ED not dead yet:)
DeleteJP
'The Stock Trader’s Almanac' refers to the first five days of January as the “Early Warning System.”
Deletelooks like ED is dead. probably 4600-4550 next.
DeleteJP
4600 is the daily BB. I think we may get there quicker than most are thinking
Deletewe may have a bounce tomorrow after the open into early next week before further decline
DeleteJP
Karsi, looks like the drop has stopped at 4700.. whats the direction like now?
ReplyDeleteLower for 20d cycle low it could last another day or two max three... I do not have intraday charts at the moment. Then higher for several days and 20d high.
Delete20d high means what level, if you can check when you have checks will be good. I dont understand what is 20d high.
DeleteKrasi, do you think something else of ED in the long term?
ReplyDeleteYes, it is over the top was in 2022 and this is just a test double top.
DeleteDouble top or a little more (4880 because there are trend lines at these levels) in a week for 20d high?
ReplyDeletewe have strong positive divergences short term. we "should" get a good bounce early next week.
ReplyDeleteJP
More red from Boeing maybe. Daily BB at 4640 area
DeleteThanks krasi
ReplyDelete