Trading trigger - buy signal.
Analysis - final wave completing the correction and turn lower to complete the 4y cycle low. At intermediate term high now topping process during the holidays.
P.S. - for a trade both analysis and trigger should point in the same direction.
TECHNICAL PICTURE and ELLIOTT WAVES
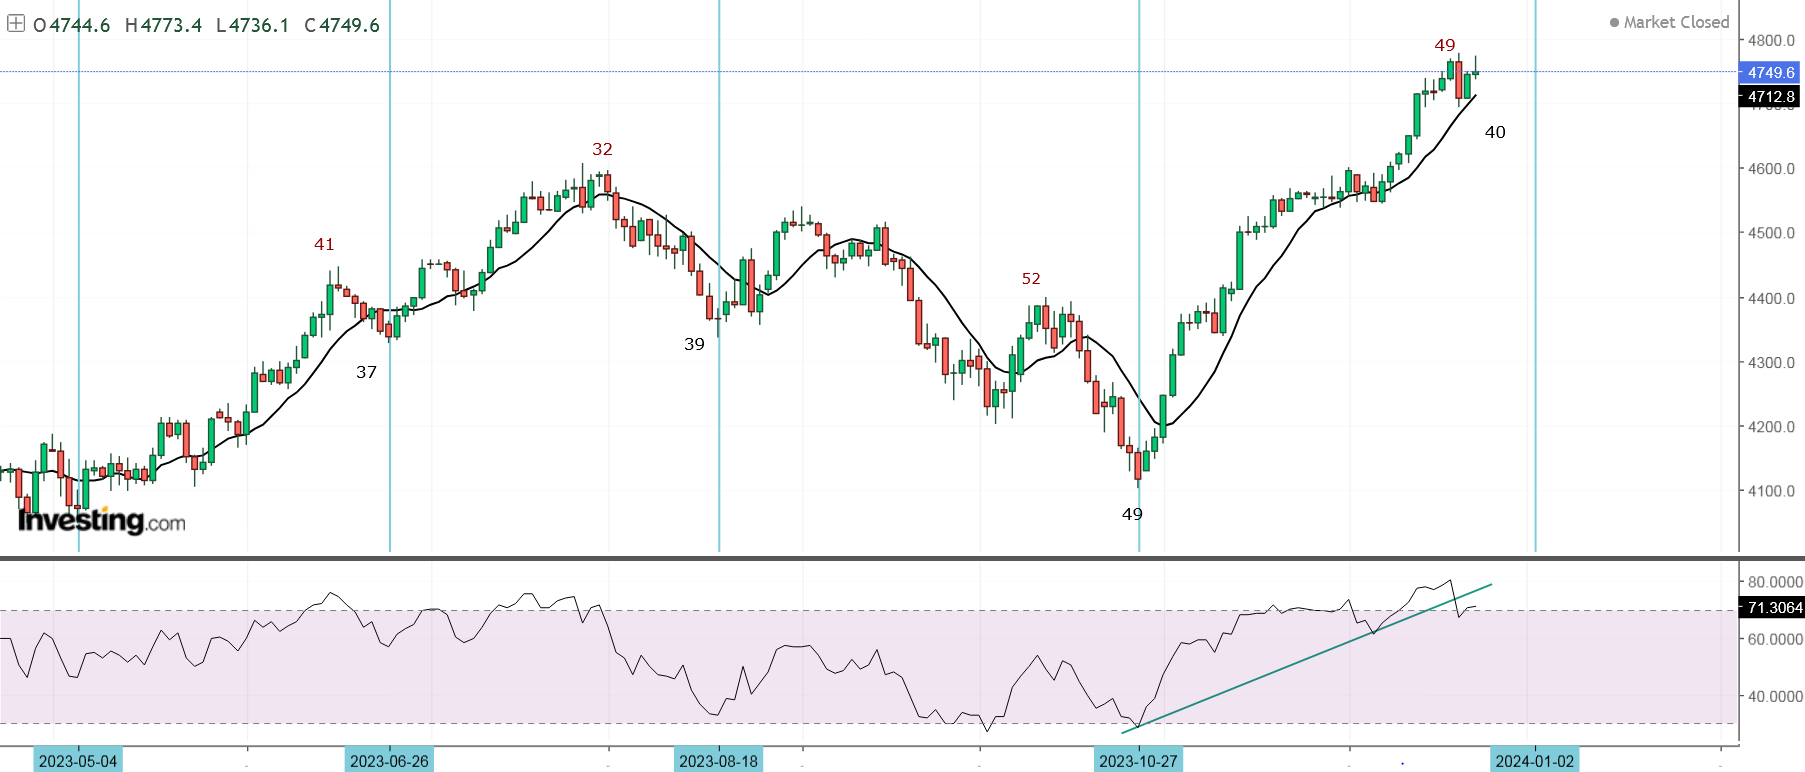
Short term - the second leg completed... a-b-c zig-zag, until we see technical damage it still could be 1-2-3 and this is reaction lower wave 4.

Intermediate term - two zig-zags down and up with the same size... next should be decline probably C-wave for a flat.

Long term - 4y cycle high the end of 2021, now a-b-c lower into 4y cycle low in Q1 2024. Very long term - most likely huge double zig-zag from the 2009 low.If we are lucky this is some topping pattern triangle or ED and there is one more high. If not multi year decline has started.

MARKET BREADTH INDICATORS
Market Breadth Indicators - topping, some with divergences.
McClellan Oscillator - multiple divergences.
McClellan Summation Index - buy signal, very overbought.
Weekly Stochastic of the Summation Index - buy signal, overbought.
Bullish Percentage - overbought.
Percent of Stocks above MA50 - overbought.
Advance-Decline Issues - could not reach overbought level, double divergence.
Fear Indicator VIX - spike higher.
HURST CYCLES
Short term cycles - we have mature 20w cycle high and first reaction lower... I expect some kind of topping, usually M-pattern(two highs). The logical path is 10w low and 5w high after the holidays then decline into 20w low.

Week 8 for the 20w cycle. Rising into 20w cycle high currently at week 21 discussed above.
Long term the previous 4y cycle high is repeating - 3x40w cycles/two years for mid-cycle high(2018-2019 / 2022-2023) and down into 4y low.


Merry Christmas Krasi!
ReplyDeleteMerry Christmas Roberto and to the rest of the readers!
DeleteI see other cycles counts if we see new highs. For example: June 2023 40w high and low, October 20w high and now it is only 10w high and next week decline into 10w low or even last wednesday was 10w low
ReplyDeleteThis is very wrong analysis. The two highs are well defined 5 months apart which is 20w cycle - period.
DeleteIf we see another high this will be the third extended cycle lasting 25 weeks(one more 5w cycle) - see the previous two from the August.2022 high lasting 25 weeks each.
This is shown on the cycle chart with 10w low -> 5w high. At the moment it is too early to say lower/higher high until we see the reaction lower.
Then is it possible last Wednesday was 10w low?
DeleteOr al least 5w low?
DeleteIt does not look so.
DeleteThank you much, Krasi, for all that you have provided here in charts, perspective, and sanity during 2023. May peace be with you and yours. Take care.
ReplyDeletemerrry christmas krasi and thank your for all your work. 2024 is going to be exciting. all the best.
ReplyDeleteJP
Thanks for sharing your insights Krasi. Merry Christmas and a Happy New Year!
ReplyDeleteThanks for all your work Krasi and Merry Christmas
ReplyDeleteThanks a lot for your analysis. And I hope you had a Merry Christmas. And I wish you a Happy New Year.
ReplyDeleteKeep up the good work!
Okay…so we are looking for down move this week and/or next….right?
ReplyDeleteNext week when this 20d cycle high is completed.
Deletekarsi, any movement update on this stale market?
ReplyDeleteDouble zig-zag with three different Fibo measurements around 4815 - https://invst.ly/12tlc7
Deletethanks! based on the fibo measurement, roughly when are we expecting the market to correct/crash?
DeleteThe longer term cycles are already very stretched. Today is day 7 for the 20d high so we have the minimum... short said from cycle perspective any moment.
DeleteThe pattern is very choppy so precise forecast is not possible.
Last week was 20d low and maybe something else ...
ReplyDeleteYes, it is on the chart above the "10", no it is nothing more.
DeleteKarsi, are you shorting the market? do you accumulate shorts/put, or wait for the breakdown? if so, what is the key level to watch to enter short?
ReplyDeleteLow risk entry is the next 5w high because we should see soon 10w low.
DeleteThose who want to squeeze more need to cost average - some part now and adding at the next high.
Yes, I am building short position.
First sample of short
ReplyDeleteIt looks like 10d low today or tomorrow
ReplyDeleteI do not use shorter than 20d cycles because you have to dig in the hourly charts....
DeleteHi Krasi, do you think bonds will see a lower low? Hoping you will publish the long term update by end of the year.
ReplyDeleteBonds will move higher first into 4y cycle high probably mid-2024 then lower low will follow.
DeleteSaw this interesting counterintuitive piece of data today which seems to be saying a bull market is about to start. Any thoughts?
ReplyDeletehttps://x.com/jasongoepfert/status/1740828845543141732
The chart does not hint new bull market at all.... not even close. This is your conclusion based on what?!?
DeleteTwo occasions in huge sideways correction notice there is extremes in both directions - this is exactly what I mention in my new post.
The third occasions is after severe bear market and extreme oversold level which is normal when a trending bull market starts.
The fourth one is at a top - no severe correction or extreme oversold level .
Short said zero statistical relevance.
Karsi, has it started? today first day of trading goes down 30 points on SPX? or we see another ATH?
ReplyDelete