Trading trigger - buy signal, close to the next high.
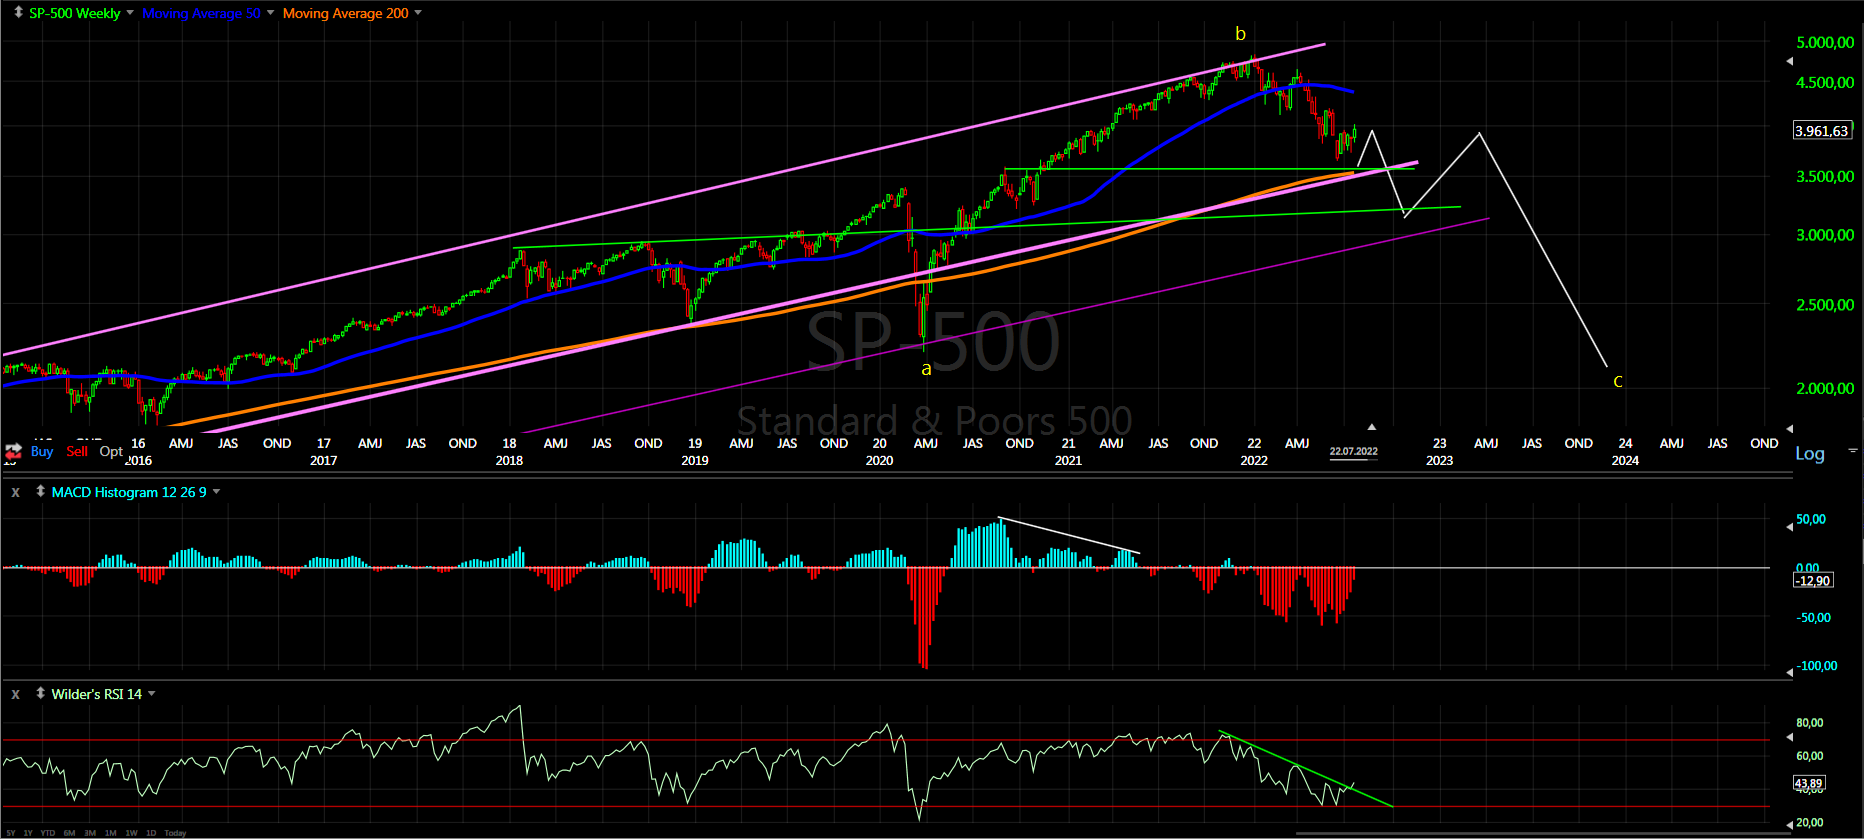
Analysis - long term sell the rips, we have major top. Possible intermediate term high.
P.S. - for a trade both analysis and trigger should point in the same direction.

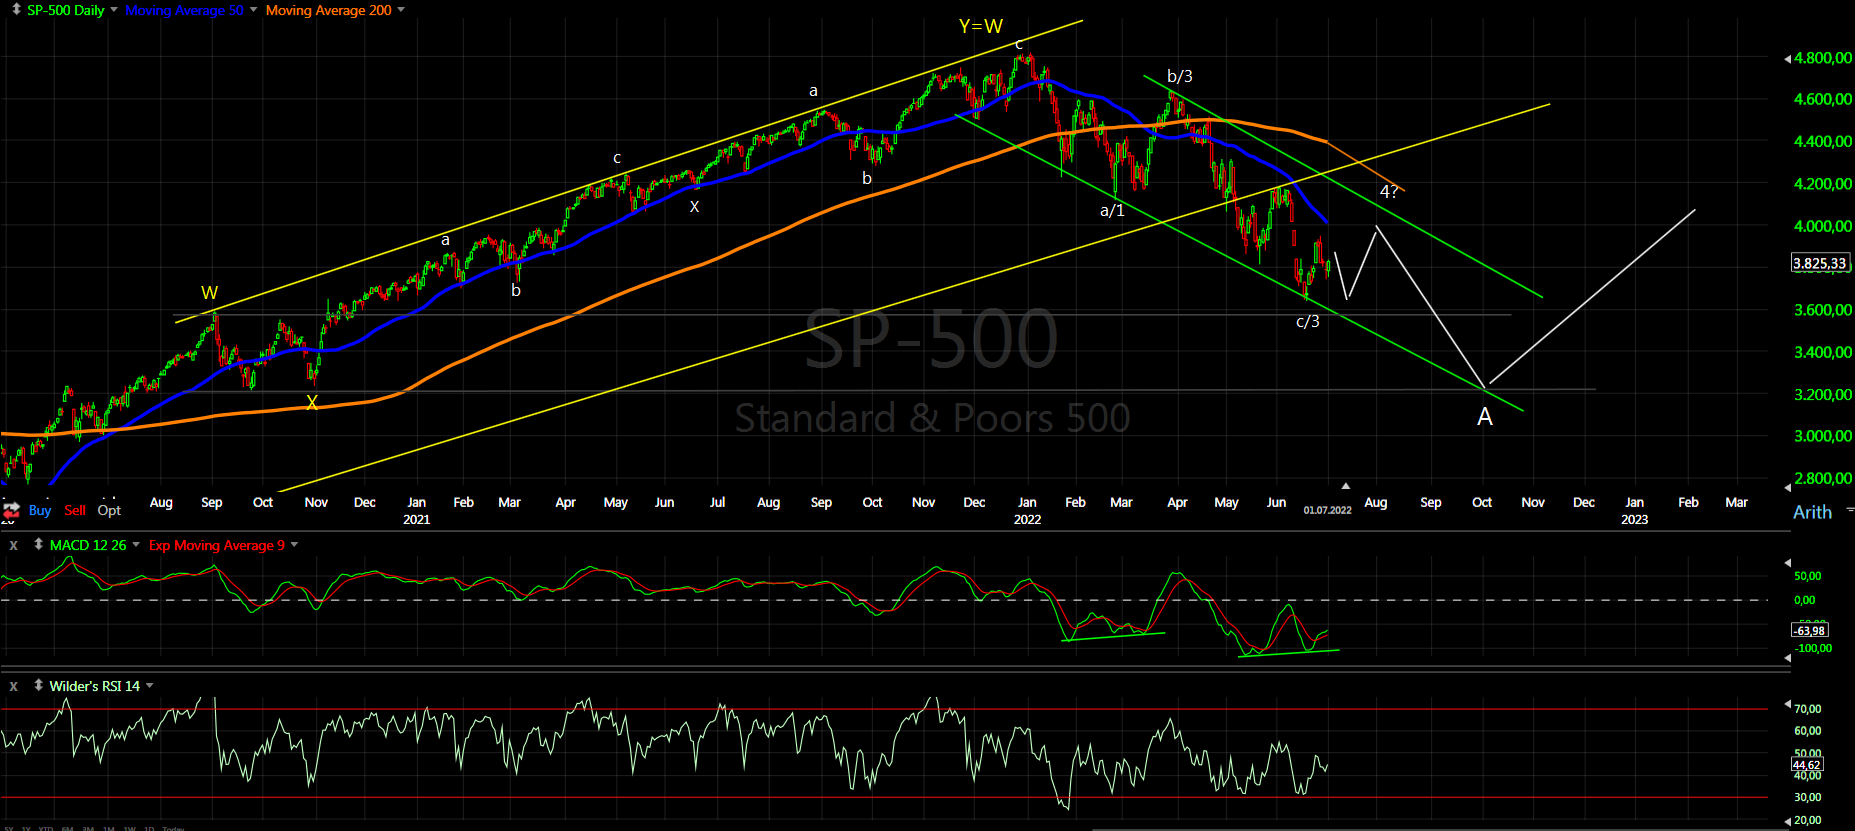
TECHNICAL PICTURE and ELLIOTT WAVES
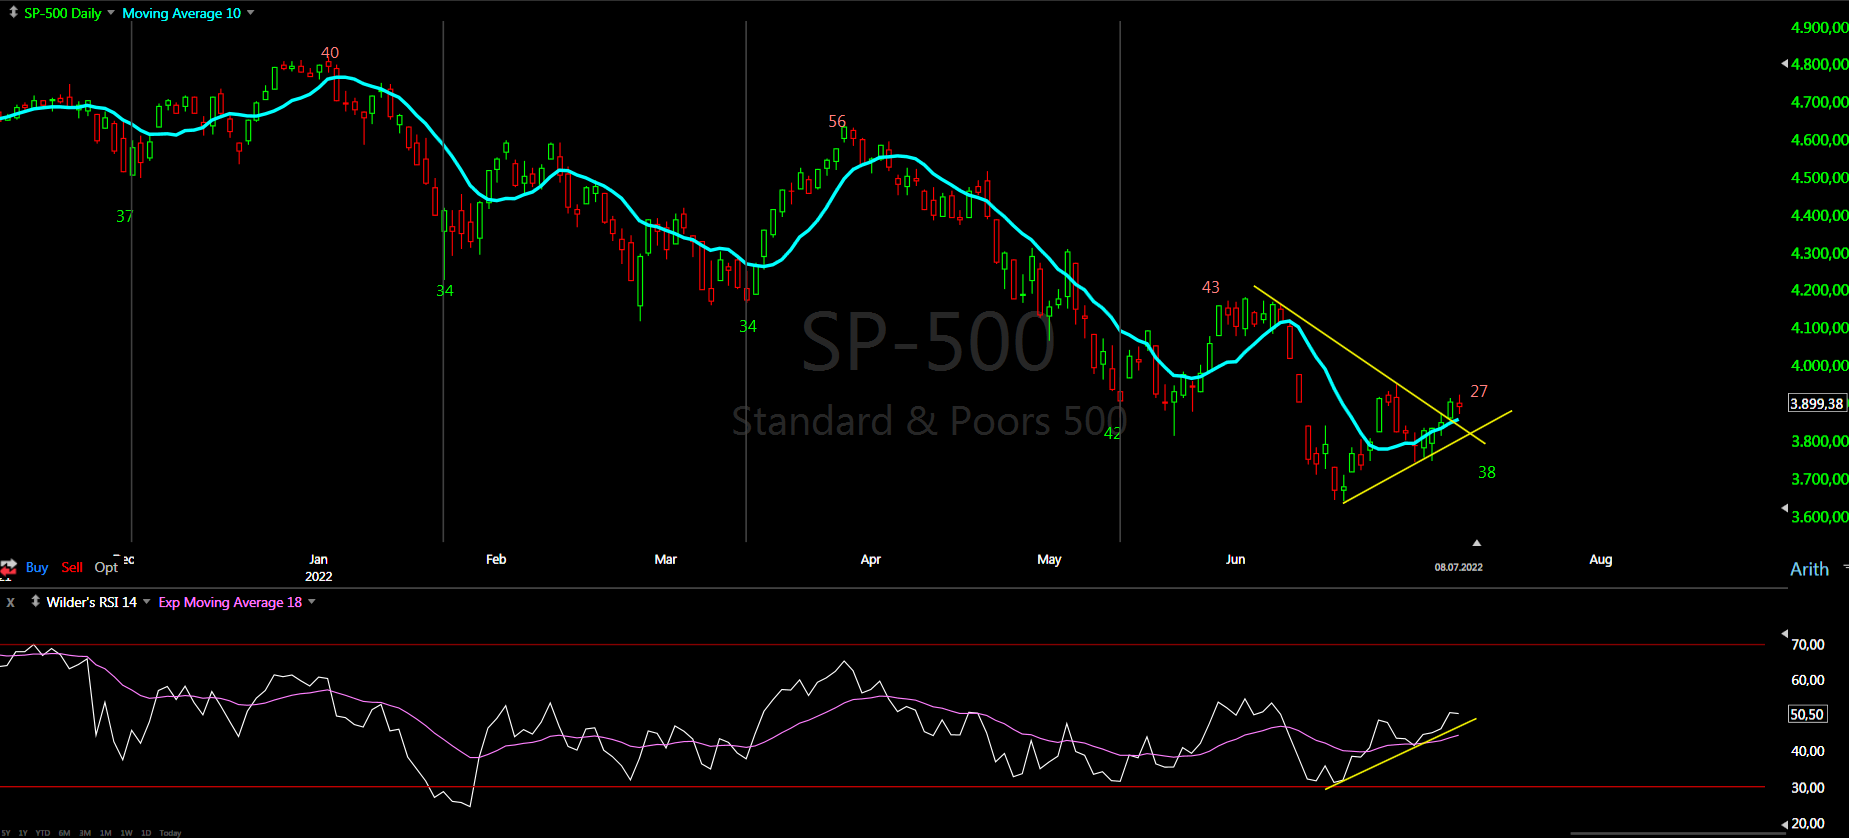
Short term - it looks like double zig-zag with c-wave extending 1.618 the length of the a-wave. If it is part of bigger corrective pattern or not? We will know in a few weeks.

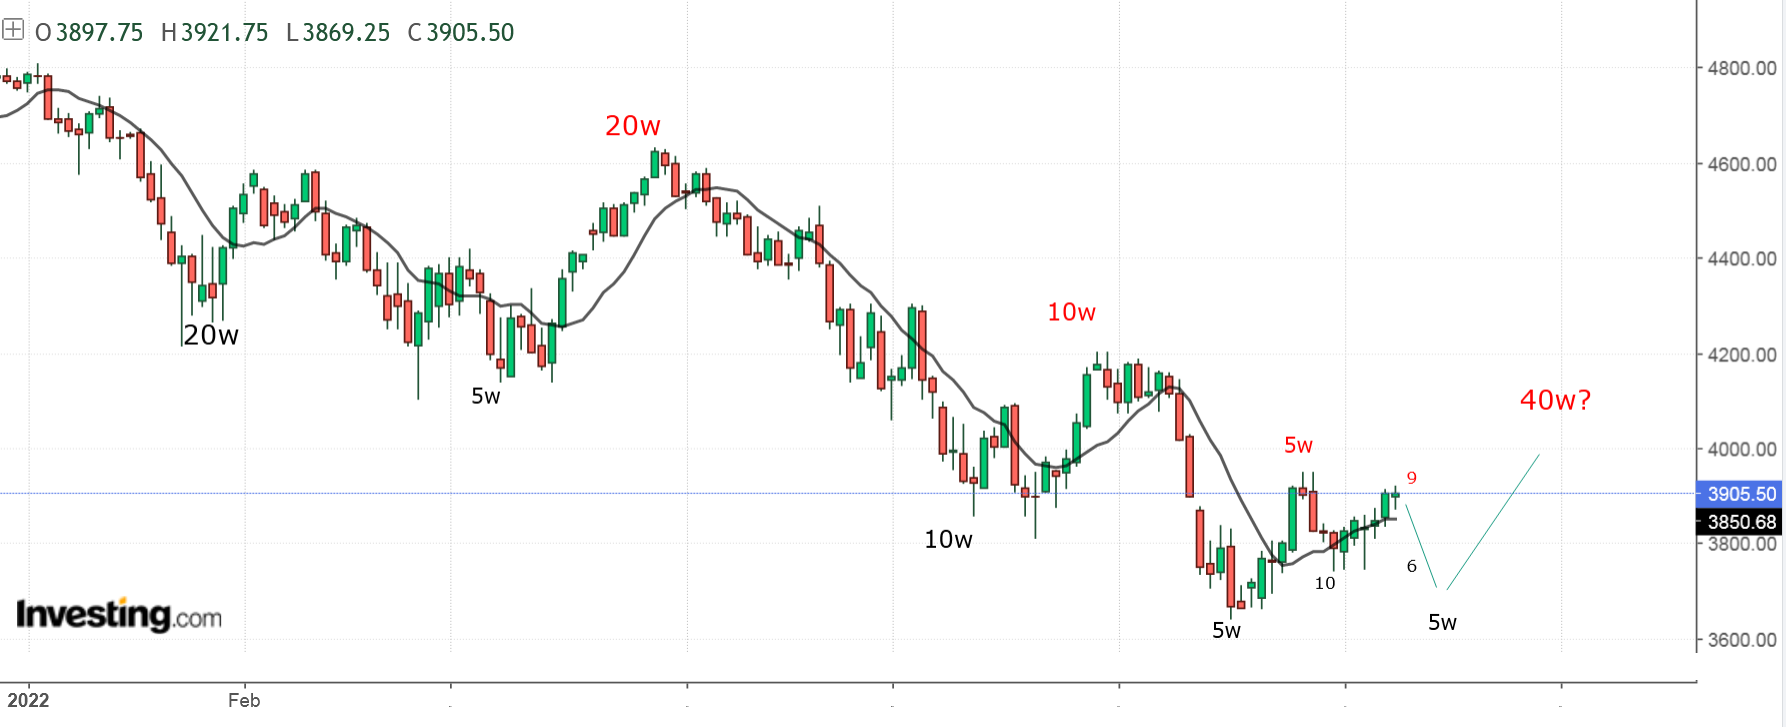
Intermediate term - One corrective pattern should be completing at the trend line so this could be the top or it is part of a bigger corrective pattern. In the case of bigger corrective pattern the top should have been in January and we have double zig-zag lower and in the middle of a B-wave for the 40w high.... after this week a doubt this scenario.

Long term - We saw the high, if we are lucky this is b-wave, if not huge double zig-zag from the 2009 low was completed and it will get very ugly in the next years.

MARKET BREADTH INDICATORS
Market Breadth Indicators - reached overbought levels.
McClellan Oscillator - overbought.
McClellan Summation Index - buy signal.
Weekly Stochastic of the Summation Index - buy signal.
Bullish Percentage - at the overbought level 70.
Percent of Stocks above MA50 - at the overbought level 75.
Fear Indicator VIX - heading lower.
Advance-Decline Issues - overbought level.
HURST CYCLES
Short term cycles - at 10w high, next should be decline until mid-August for 10w low.

Week 30/36 for the 40w cycle high (from January/November). If you count from November this should be the high. If you count from January it will take more time - the end of August or later.