May 29, 2021

Weekly preview

The b-wave continues for another week. The indicators are resetting to the upside so the indices are preparing to move lower again - no it is not a consolidation before continuing higher. Many think when it takes longer it is somehow not a top - good luck with that. The only bullish on this longer topping phase is the odds are increasing to see the green scenario shown on the weekly chart.


TRADING
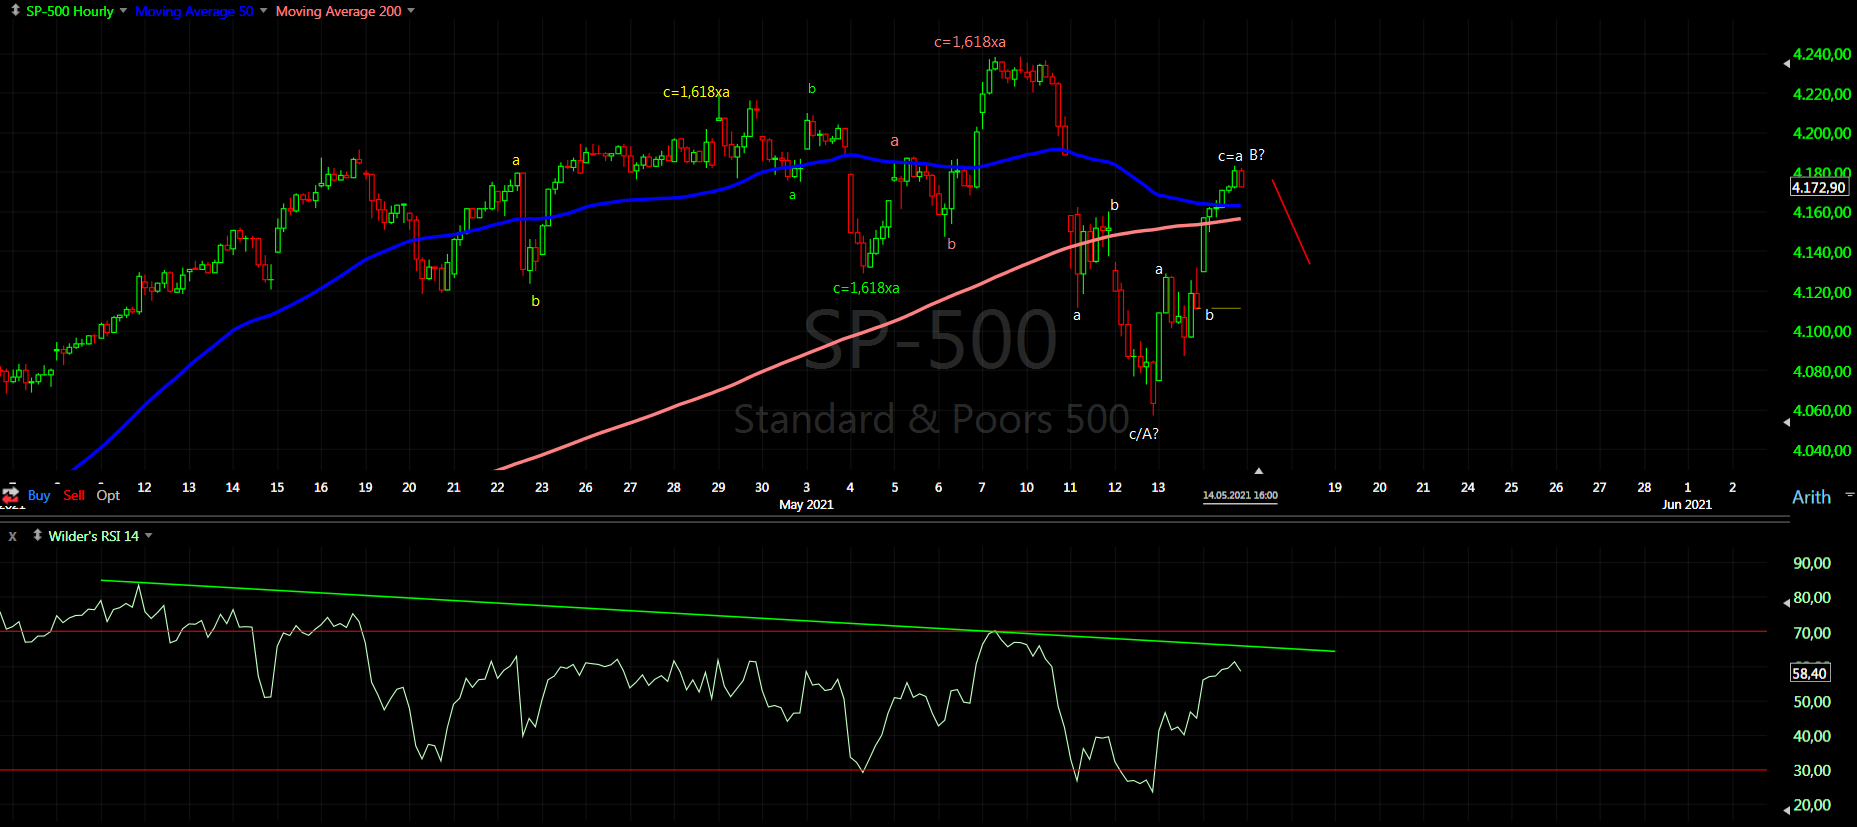
Trading trigger - buy signal, still above MA10. RSI is testing the trend line so expect to see sell trigger soon.
Analysis - sell signal, we have transition from 18 month high into 18 month low.

P.S. - for a trade both analysis and trigger should point in the same direction.


TECHNICAL PICTURE and ELLIOTT WAVES
Short term - another messy pattern either double zig-zag or simple zig-zag with c as ED currently in wave 4 of it.


Intermediate term - from the March low we have one big zig-zag consisting of two zig-zags, which itself consist of zig-zags. You can call it W-X-Y, but there is no impulses.
RSI resetting higher to the down sloping trend line, the usual behavior after vertical decline away from it. There is minimum one more leg lower before we can think of completed correction.


Long term - the move from March 2020 is completed and we are seeing transition from up to down. Expect 5-7 weeks lower and we will watch how big the decline will be.


MARKET BREADTH INDICATORS
Market Breadth Indicators - are in sell mode barely reacting.
McClellan Oscillator - resetting higher after sligthly oversold level.
McClellan Summation Index - turned up.
Weekly Stochastic of the Summation Index - sell signal.
Bullish Percentage - bounce a little bit from 70, but very weak.
Percent of Stocks above MA50 - testing 75, but very weak.
Fear Indicator VIX - retracing with a zig-zag lower and higher low so far.
Advance-Decline Issues - another lower high.


HURST CYCLES
Short term cycles - waiting for the 5w high and turn lower into 5w low.
Trying to count the cycle highs is very difficult in the last 6 weeks - there is a reason why in Hurst cycle theory there is no high-to-high analysis:) The reason is if you sum cycles with different lengths they all will make a bottom at the same time, but highs at different time. The bottom is event clear visible, the top is process taking time and sometimes messy.


Week 30 for the 40w cycle. RSI broke below the MA, but still at support from one of the trend lines now trying to test the brake. We are seeing the turn lower into 18m low.

May 22, 2021

Weekly preview

More volatility, it looks like sideways b-wave for 5w high, next is c-wave lower into 5w low.


TRADING
Trading trigger - playing with MA10.... I think the cross confirms 10w low, but expect lower low for the 10w high. Sell if we see cross lower next week.
Analysis - sell signal, we have transition from 18 month high into 18 month low.

P.S. - for a trade both analysis and trigger should point in the same direction.


TECHNICAL PICTURE and ELLIOTT WAVES
Short term - it looks like sideways b-wave... a flat less likely triangle.


Intermediate term - I see one big zig-zag up consisting of two zig-zags. You can count it as W-X-Y(red) classic EW, but there is no impulses, more likely series of zig-zags A-B-C(yellow).
Lower to MA50 and bounce again, still caught between MAs and the trend lines. All part of topping process the direction is lower.


Long term - the move from March 2020 is completed and we are seeing transition from up to down. Expect 5-7 weeks lower and we will watch how big the decline will be.


MARKET BREADTH INDICATORS
Market Breadth Indicators - are in sell mode.
McClellan Oscillator - around zero retracing the decline.
McClellan Summation Index - sell signal.
Weekly Stochastic of the Summation Index - sell signal.
Bullish Percentage - trending lower, but still above 70.
Percent of Stocks above MA50 - trending lower below 75.
Fear Indicator VIX - retracing and making higher lows so far.
Advance-Decline Issues - weak, but has not broken convincingly lower, at the moment in the middle of the range.


HURST CYCLES
Short term cycles - I think the indices should turn lower into 5w low.


Week 29 for the 40w cycle.

May 15, 2021

Weekly preview

Volatile week we saw 10w low and now close to 5w high. The cycle high was mid-April, the indices are topping and the pattern is similar to Jan-Feb last year.

P.S. Updated the post "Trading System" see the links on right side. I have tried to explain how to use cycles and MA10 for low risk trades.


TRADING
Trading trigger - testing MA10. Sell if we se turn lower next week.
Analysis - sell signal, not confirmed we have transition from 18 month high into 18 month low.

P.S. - for a trade both analysis and trigger should point in the same direction.


TECHNICAL PICTURE and ELLIOTT WAVES
Short term - more zig-zags lower and higher. I think all this is part of a bigger zig-zag lower.


Intermediate term - I see one big zig-zag up consisting of two zig-zags. You can count it as W-X-Y(red) classic EW, but there is no impulses, more likely series of zig-zags A-B-C(yellow).
Lower to MA50 and bounce classical TA, now caught between MAs and trend lines. All part of topping process the direction is lower.


Long term - the move from March 2020 is completing and we are seeing transition from up to down. Expect 6-8 weeks lower and we will watch how big the decline will be.


MARKET BREADTH INDICATORS
Market Breadth Indicators - are in sell mode.
McClellan Oscillator - made lower low and broke the trend line connectiong all the lows since March 2020, now retracing and close to zero.
McClellan Summation Index - sell signal.
Weekly Stochastic of the Summation Index - sell signal.
Bullish Percentage - pointing lower, but above 70.
Percent of Stocks above MA50 - turned up, but not close to the previous highs.
Fear Indicator VIX - forming big wedge from the March 2020 high - touched the upper trend line this week and retracing. I expect higher low and break out from the wedge.
Advance-Decline Issues - weak, but still has not broken convincingly lower, at the moment in the middle range.


HURST CYCLES
Short term cycles - it looks like 10w low this week. I wrote a few weeks ago it counts better as three longer 20d cycles instead of four and it seems this is exactly what happened. The highs - the indices are close to 5w high. It is already long enough 20 days/4 weeks... it could turn lower on Monday or it could take another 2-3 days, cycles vary we have to wait.
With the price action this week the model with 18m high mid-April makes more sense it is the one which looks better anyway.


Week 28 for the 40w cycle.

May 8, 2021

Weekly preview

Some indices like SPX,DJ,NYSE made new highs so the top is maybe one 5w cycle later.... or it is the same setup like Jan-Feb last year. This 5ww cycle needs another 3-4 days so watching what is happening next week.
Judging by the level of bullshit and insults, I have to listen, I am 100% sure we are very close to reversal.


TRADING
Trading trigger - buy signal. Most likely daily cycle low this week and daily cycle high in the next days - this will explain why RSI is not looking very supportive for a rally.
Analysis - sell signal expected. Inflection from 18 month high to 18 month low is imminent.

P.S. - for a trade both analysis and trigger should point in the same direction.


TECHNICAL PICTURE and ELLIOTT WAVES
Short term - plenty of zig-zags in both directions... according to cycles a few more days are needed, below 62% retracement(4170 red line) it is over.
Some will count it as impulse 1-2-3 - I am sceptical, from the March low zig-zags everywhere.


Intermediate term - I see one big zig-zag up consisting of two zig-zags. You can count it as W-X-Y(red) classic EW, but there is no impulses, more likely series of zig-zags A-B-C(yellow).
Waiting for the market's final strokes to complete the pattern. RSI is sending clear message that the pattern is completing.


Long term - the move from March 2020 is completing. Expect 7-9 weeks lower and we will watch how big the decline will be.


MARKET BREADTH INDICATORS
Market Breadth Indicators - still weak and ready for a top.
McClellan Oscillator - above zero, multiple divergences.
McClellan Summation Index - neutral, weak with divergences.
Weekly Stochastic of the Summation Index - buy signal, but probably topping.
Bullish Percentage - double top, weak with divergence.
Percent of Stocks above MA50 - short term divergences.
Fear Indicator VIX - short term divergences.
Advance-Decline Issues - weak with multiple divergences.


HURST CYCLES
Short term cycles - most likely 10w low occurred 2-3 days earlier and now heading into 5w high. For comparable length another 3-4 days are needed to complete the 20d cycle and probable 18m high.
Another possible model to satisfy the high-low sequence and the new high this week. The problems - the first 5w cycle is 5-6 weeks long when the usual length is 4 weeks, we do not have high followed by a low rather stretched somewhere in time with higher low, other indices like DAX/NDX did not make higher high... I do not know which one is better - this one or from last week.
The more important for both models the lows are the same - the 10w lows seem to occur very regularly.... if it continues the same way the final low should be the first week of July.


Week 27 for the 40 week cycle. If the model above is the right one the 40w cycle high is now 36 weeks long pretty stretched.

May 1, 2021

Weekly preview

The market chose the bearish path topping and double top with divergences - normal this is the high for the move from the March low.

I had a mistake in the short term cycle chart, the high-low sequence was wrong now it is corrected. It is showing the same setup like the previous top - the cycle top was mid-April(like January 2020) and now we are seeing the price top. As I wrote last week this double top is of lower cycle degree so the topping should take 2 weeks instead of 4. By the way not all indices are making new highs as in February last year.


TRADING
Trading cycle - still above MA10, but the index looks very tired.... RSI is below the MA with divergences. The analysis is pointing to important high so it is time to be cautious.


TECHNICAL PICTURE and ELLIOTT WAVES
Short term - continued higher for double top into the area of several Fibo projections. It looks like completion of this red a-b-c.
The bullish case is expanded flat a-b-c green, than the crucial level is 4100. It should not move below it if this is only sideways pullback.... I doubt this.


Intermediate term - I see one big zig-zag up. You can count it as W-X-Y(red) classic EW, but there is no impulses just more zig-zags. More likely series of zig-zags A-B-C(yellow).
Again the trend line is around 4100 and it should hold for bullish outcome. I think it will be broken and MA50 will be tested.


Long term - the move from March 2020 should be completed. I expect 7-9 weeks lower and we will watch how big the decline will be.


MARKET BREADTH INDICATORS
Market Breadth Indicators - now looking ready for a top.
McClellan Oscillator - below zero with multiple divergences.
McClellan Summation Index - buy signal, but weak with divergences.
Weekly Stochastic of the Summation Index - buy signal.
Bullish Percentage - double top.
Percent of Stocks above MA50 - short term divergence and turned lower.
Fear Indicator VIX - short term divergence.
Advance-Decline Issues - turned lower multiple divergence.


HURST CYCLES
Short term cycles - possible 20d high waiting for confirmation on Monday. This 20d cycle seems very weak especially if you look other indices like NDX,DJ,DAX so I expect turn lower into cycle low of higher degree. The 20d lows - I have the feeling the current 10w cycle counts better with three longer 20d cycles instead of 4x20d cycles.
Corrected the high-low sequence and it is showing the top in mid-April.


Week 26 for the 40w cycle. I am big believer that the high-low sequence should be obeyed, which means the 40w cycle high was mid-April at week 33.


Tom Demark SEQUENTIAL AND COUNTDOWN - this technique spots areas of exhaustion.
We have the higher high and completed TD sequential on the weekly chart, now waiting for price flip.