May 28, 2023

Weekly preview

Down and up so still waiting for resolution. NYSE/DJI are weak NDX parabolic and SPX in the middle... I have a deja vu - do you remember 2021?
Tech stocks (Mega Cap Tech the new safe haven) masking the weakness and holding the market together... not for a long. NDX two legs with rougly the same size, 9 months(40w) from the previous significant high, 18 months from the top - good luck betting on this.
SPX did not decline significantly so more of the same mess which makes it difficult to analyze the pattern - overall two options the last wave higher is running to complete y/B(a few days) or one more decline and move higher like two more months.


TRADING
Trading trigger - buy signal, very weak cycle higher two many crosses.
Analysis - long term sell the rips. Intermediate term - topping for important high.

P.S. - for a trade both analysis and trigger should point in the same direction.


TECHNICAL PICTURE and ELLIOTT WAVES
Short term - it looks like this to me. The last two months are such a mess....


Intermediate term - double zig-zag from October.2022 in white or double zig-zag from June.2022 in yellow. Alternate triangle for the y-wave in red.


Long term - most likely huge double zig-zag from the 2009 low. If we are lucky this is lower degree b-wave(green) and there is one more high. If not multi year decline has started.


MARKET BREADTH INDICATORS
Market Breadth Indicators - turned lower, nothing interesting.
McClellan Oscillator - below zero.
McClellan Summation Index - sell signal.
Weekly Stochastic of the Summation Index - sell signal.
Bullish Percentage - turned lower.
Percent of Stocks above MA50 - turned lower.
Fear Indicator VIX - turned higher.
Advance-Decline Issues - up and down in the middle of the range.


HURST CYCLES
Short term cycles - next week we should see 5w high which should be 20w high too then turn lower into 20w low.


Week 11 for the 20w cycle low, week 16 for the 20w cycle high. The cycles of higher degree are not perfectly clear.

May 21, 2023

Weekly preview

At the higher end of the range with divergences. Tech stocks masking the weakness just look at NYSE,DJ,RUT and it is getting clear.
Expect decline and final push higher to complete the B-wave, but I am not sure about the degree of the decline extended 10w cycle(1-2 weeks decline) like the previous two or 20w cycle low(4 or more weeks decline). On the daily chart for the B-wave we have too many possible combinations, but the outcome is not much different.

In a few weeks the pattern from the October low will have the same length as the decline Jan-Oct.2022 roughly 9 months each, which means the important 18m low was more likely in Oct.2022 instead of June.2022 - wave-A with length 6 months and B-wave 12 months.

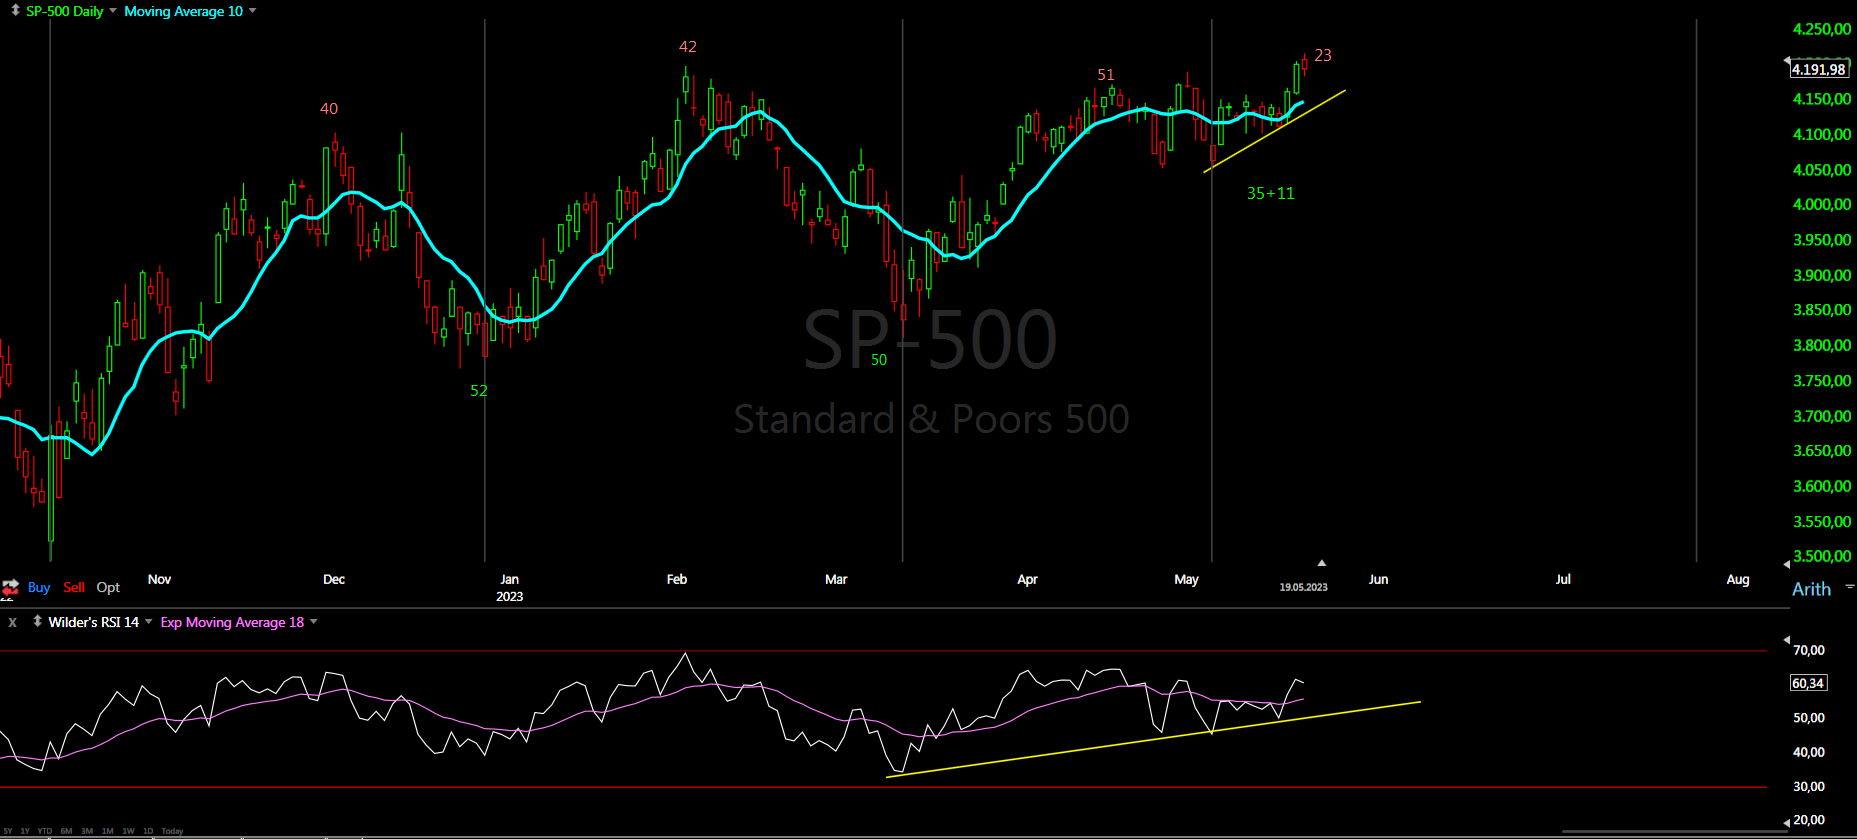
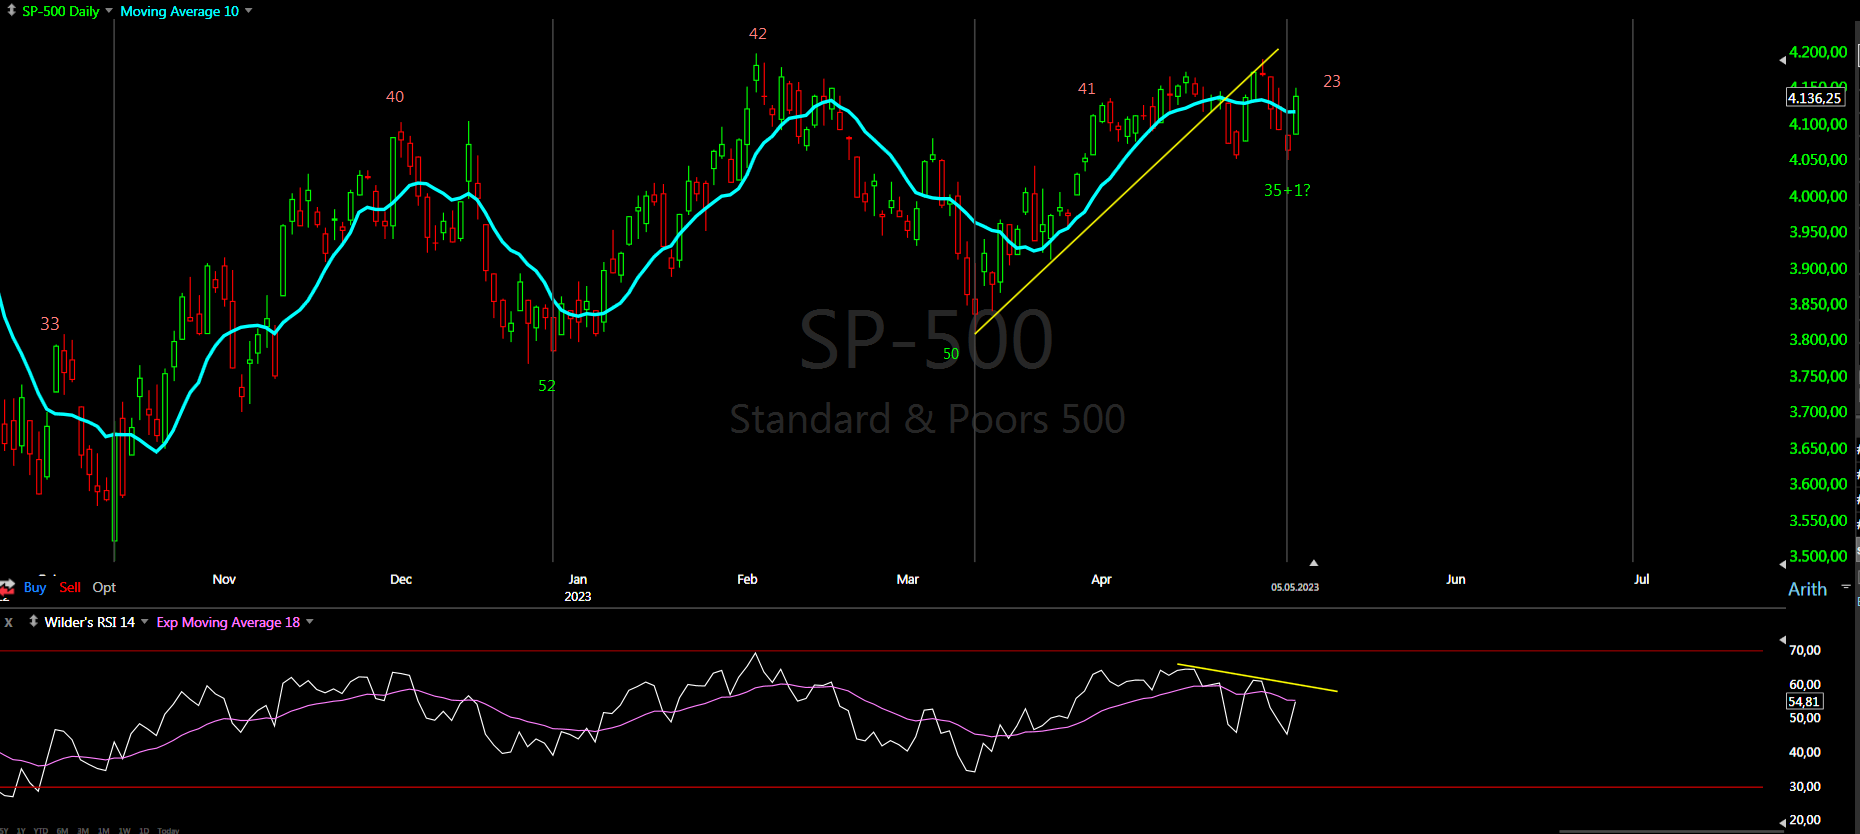
On the daily chart sp500 needed 10 days to retrace 4 days decline, on the weekly chart 10 weeks to retrace 5 weeks decline, on the monthly chart almost 8 months have not retraced 2 months decline so in a messy pattern and B-wave not reversal.
This is for those with the bull market.... there will be no bull market before we see lower low. Four year cycle lasts 4 years I do not understand what is so difficult to understand it can not be more simple.


TRADING
Trading trigger - buy signal.
Analysis - long term sell the rips, we have major top. Intermediate term probbably triangle difficult to trade.

P.S. - for a trade both analysis and trigger should point in the same direction.


TECHNICAL PICTURE and ELLIOTT WAVES
Short term - two zig-zags with roughly the same size for double zig-zag higher and now move in the opposite direction skewed by tech stocks. For the real pattern look NYSE for example.
Notice the double divergences...


Intermediate term - four patterns two variations of a double zig-zag and two triangles, both waves A and B will have roughly the same size and the outcome is not very different:
- complex w-x-y with x-wave(white) triangle. and B will retrace close to 62%.
- y/B(yellow) is the triangle and roughly 50% retracement.
- double zig-zag the top of w is in early February then x(red) and now in b/y/B and 62% retracement.
- double zig-zag the top of w is in early December then x(green) and now in c/y/B and 62% retracement.


Long term - most likely huge double zig-zag from the 2009 low B-wave was completed and multi year decline has started. If we are lucky it is lower degree b-wave.


MARKET BREADTH INDICATORS
Market Breadth Indicators - turned higher nothing to suggest strength so far.
McClellan Oscillator - around zero.
McClellan Summation Index - buy signal.
Weekly Stochastic of the Summation Index - sell signal.
Bullish Percentage - turned higher, in the middle of the range.
Percent of Stocks above MA50 - turned higher, in the middle of the range.
Fear Indicator VIX - turned lower.
Advance-Decline Issues - up and down, in the middle of the range.


HURST CYCLES
Short term cycles - maybe extended 10w cycles consisting of 3x5w cycles as the previous two. Now at 5w high next should be move lower for the next 10w low? or 20w cycle low?


As suggested the 18m low should be in October 2022. The 40w lows/highs are at pattern inflection points as it should be and in sync with the European indices which is important.
Months ago I have suggested the 40w cycle looks like 3x10w cycles. If we have triangle the current 40w cycles low and high count better as three longer 10w cycles. If it is a double zig-zag this should be 20w high(now at week 15) from early February and next is turn lower into 20w low.

May 14, 2023

Weekly preview

Another wasted week, overall six weeks crappy price action. It feels like the market is waiting for a trigger. Sideways price action - bullish case final spike higher, bearish case rounding top.
Nothing new to add... almost one year in this range - waiting for the pattern to be completed then the second leg lower and 4y cycle low probably in October.


TRADING
Trading trigger - no signal, flat EKG:)
Analysis - long term sell the rips, we have major top. Intermediate term high - impotant high in a few weeks expected.

P.S. - for a trade both analysis and trigger should point in the same direction.


TECHNICAL PICTURE and ELLIOTT WAVES
Short term - I see zig-zag and triangle - lets see if it will play out... it is difficult to navigate such mess.


Intermediate term - It is a complex pattern I think it started in June.2022 some w-x-y, alternate w-x-y from the October low.


Long term - most likely huge double zig-zag from the 2009 low B-wave was completed and multi year decline has started. If we are lucky it is lower degree b-wave.


MARKET BREADTH INDICATORS
Market Breadth Indicators - the same... pointing lower, in the middle of the range.
McClellan Oscillator - below the zero line.
McClellan Summation Index - sell signal.
Weekly Stochastic of the Summation Index - sell signal.
Bullish Percentage - pointing lower, in the middle of the range.
Percent of Stocks above MA50 - pointing lower, in the middle of the range.
Fear Indicator VIX - up and down, complacency lower than the ATH.
Advance-Decline Issues - pointing lower, in the middle of the range.


HURST CYCLES
Short term cycles - close to 20d high... final push lower for 10w low or we saw it already?


Week 9 for the 20w cycle. Close to important high and next should be the last 40w cycle of the 4y cycle.

May 6, 2023

Weekly preview

Volatile week now we have possible 10w low which looks better, six weeks was too short.
Short term is a mess the correction looks complete again, but I will not be surprised to see one more move lower.
Intermediate term it is more clear - sideways move so expect push higher for important high... one more 5w cycle high will complete 20w cycle high from early February.


TRADING
Trading trigger - buy signal, crosses in both directions.
Analysis - long term sell the rips, we have major top. Intermediate term high - impotant high in a few weeks expected.

P.S. - for a trade both analysis and trigger should point in the same direction.


TECHNICAL PICTURE and ELLIOTT WAVES
Short term - sideways price action, it looks like complex b-wave - this is what I see currently... such corrections are impossible to forecast, the important information is correction not reversal.
I have never seen expanding triangle playing out so sudden sell off will not surprise me.


Intermediate term - the indices are a few weeks away from the top of the correction. It is a complex pattern and I am not sure where the B-wave starts - in June or October. It could be w-x-y from October or triangle starting in June.


Long term - most likely huge double zig-zag from the 2009 low B-wave was completed and multi year decline has started. If we are lucky it is lower degree b-wave.


MARKET BREADTH INDICATORS
Market Breadth Indicators - moving lower...
McClellan Oscillator - turned higher.
McClellan Summation Index - sell signal.
Weekly Stochastic of the Summation Index - sell signal.
Bullish Percentage - pointing lower, in the middle of the range.
Percent of Stocks above MA50 - up and down, in the middle of the range.
Fear Indicator VIX - up and down.
Advance-Decline Issues - moving lower.


HURST CYCLES
Short term cycles - close to 20d low which should be 10w low - do we have short cycle only 6 days? One more 5w cycle and we will have 20w cycle high from the last important high early February.


Week 8 for the 20w cycle. Close to important high and next should be the last 40w cycle of the 4y cycle.