Jul 31, 2021

Weekly preview

There is no more clarity this week, it was not expected either. Short term the price action does not look like reversal this favors the scenario ED which many are watching. I mentioned it last week, but I am skeptical I do not see the usual ED price/RSI pattern I would say another double zig-zag from the March low.
Cycles - short term it is working as expected, long term it is a guess so covering two options.


TRADING
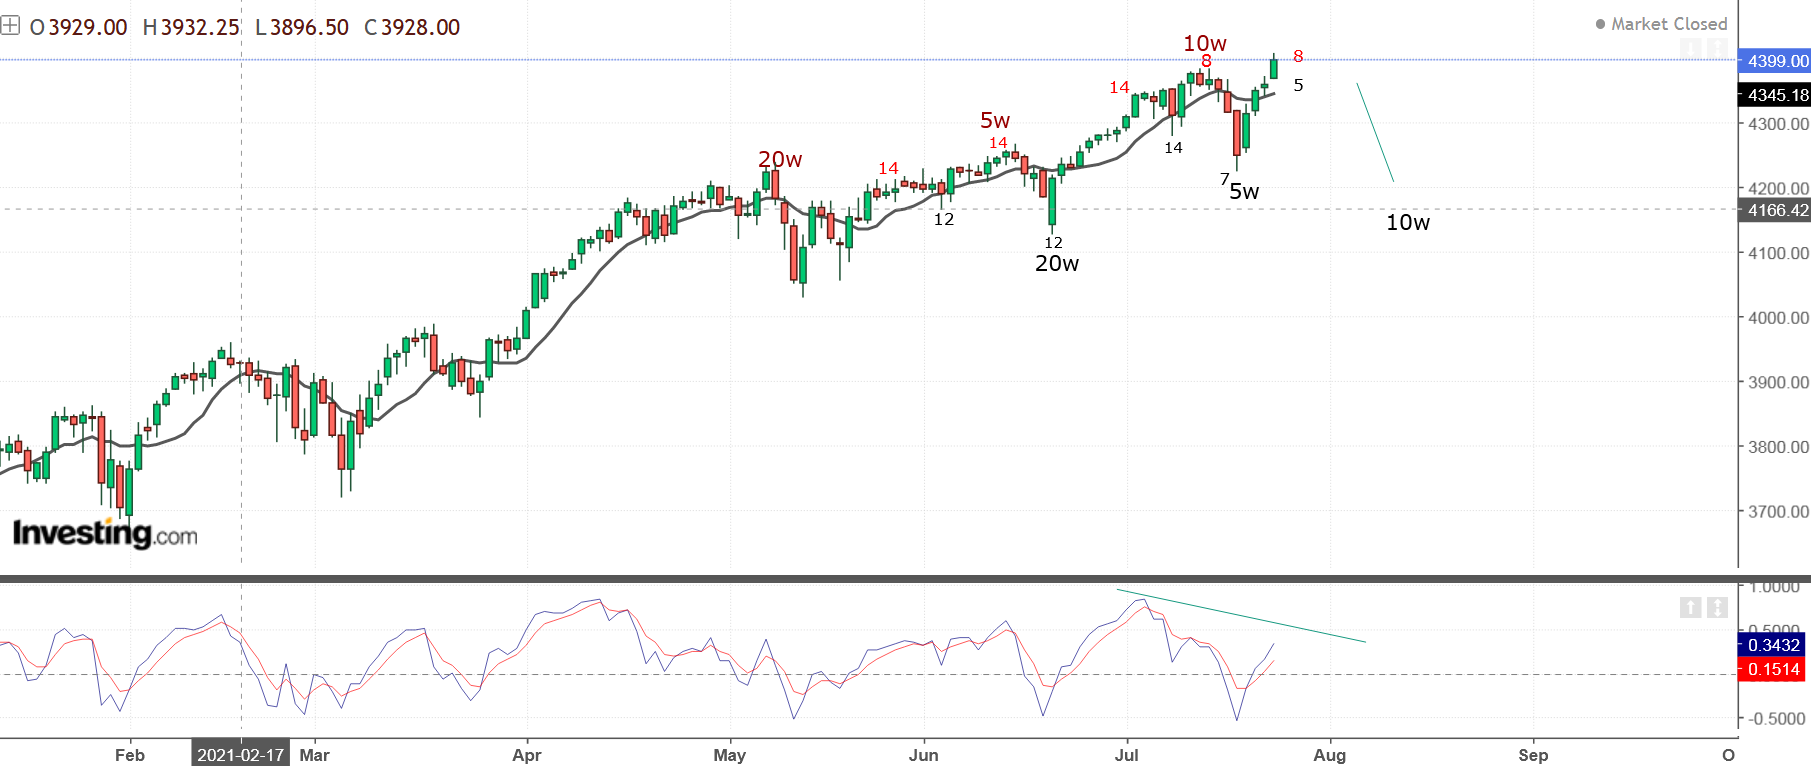
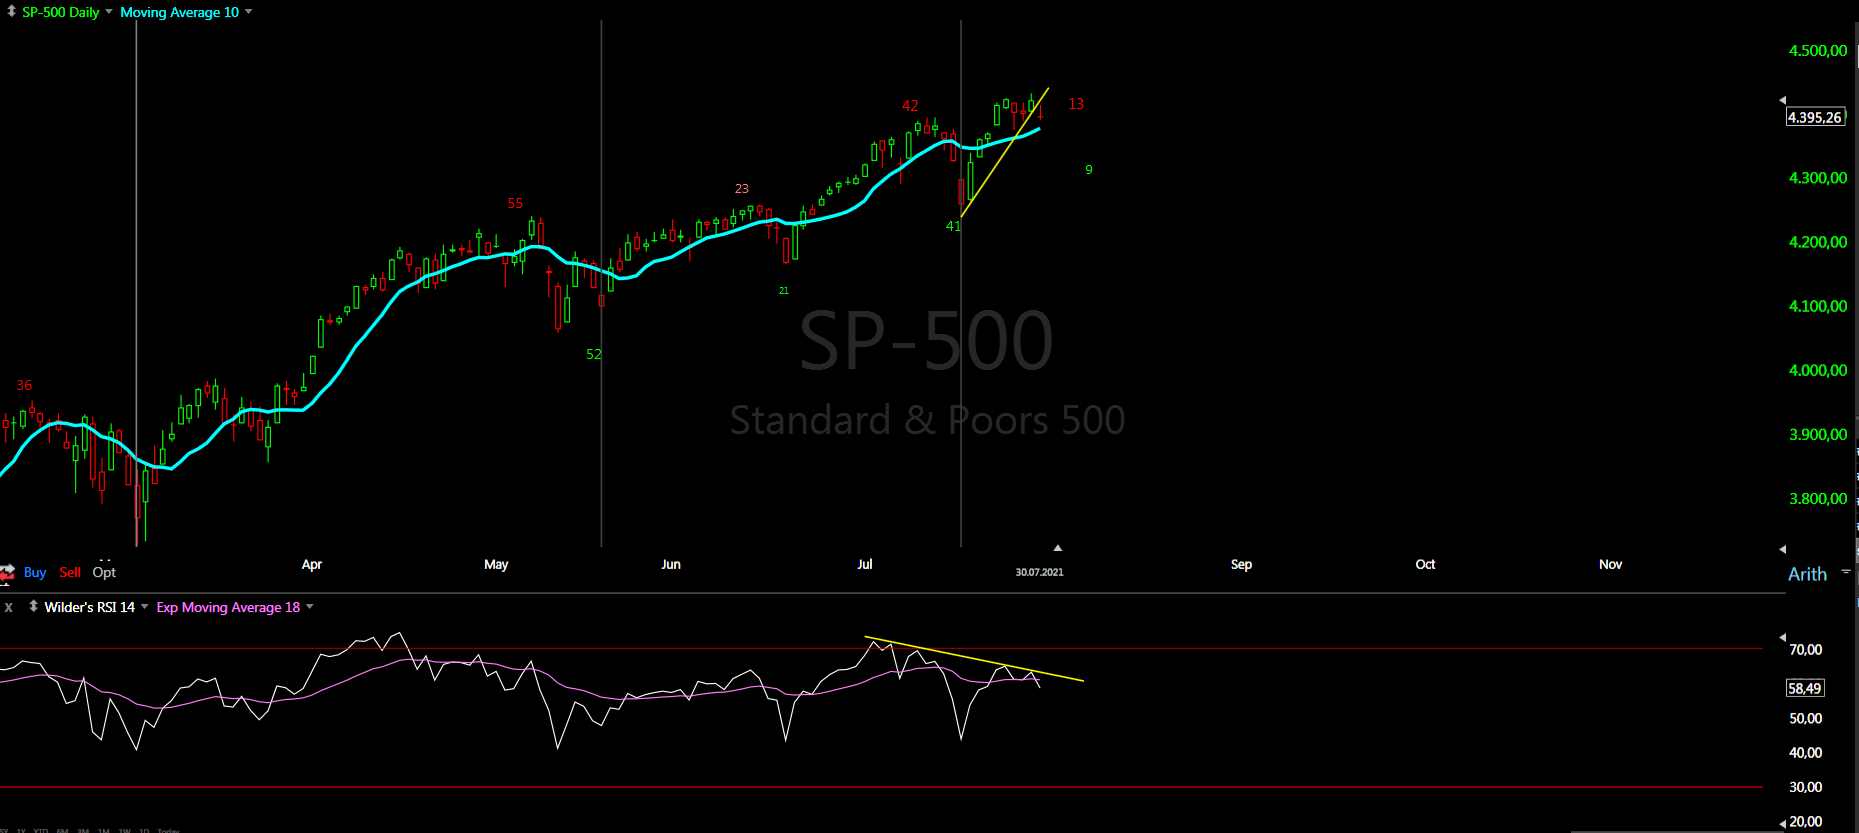
Trading trigger - buy. At the moment I think it is more likely to see support around MA10.
Analysis - sell the rips, long topping process.

P.S. - for a trade both analysis and trigger should point in the same direction.


TECHNICAL PICTURE and ELLIOTT WAVES
Short term - the two options shown a-b-c(green) as part of bigger pattern and now less likely a-b-c(white) from last week.


Intermediate term - from the March low we have one big zig-zag consisting of two zig-zags, which itself consist of zig-zags. You can call it W-X-Y, but there is no impulses.
Last week I showed the a-b-c and this is if we see continuation. Many are counting this as ED, but I do not see the usual RSI signature, way too shallow second wave, missing on DJ,NYSE,NDX. More likely it is another double zig-zag from the March low for C/Y.


Long term - topping process running for months and maturing. Some kind of b-wave and c-wave will follow.


MARKET BREADTH INDICATORS
Market Breadth Indicators - like last week, resetting and I do not see signs for a strength or reversal.
McClellan Oscillator - resetting and around the zero line.
McClellan Summation Index - sell signal.
Weekly Stochastic of the Summation Index - sell signal.
Bullish Percentage - turned up, in the middle of the range.
Percent of Stocks above MA50 - in the middle of the range, does not show signs of strength.
Fear Indicator VIX - retracing, expect higher low.
Advance-Decline Issues - bounced up from oversold level, now in the middle of the range. For the first time cumultive A/D is showing signs of topping.


HURST CYCLES
Short term cycles - 20d high as expected and now heading lower into 20d low. With the current development it seems more likely the next 20d cycle to try to make higher high.


The long term count is not very clear, there is no visible significant low, the indices do not show consistent picture so we will be sure only in hindsight where the 18m low is. Two options correction since Mai is running and we have not seen the 18m low, the second reflecting what the broader market NYSE is doing.

This is the option that the next decline is the 18m low. The 40w cycle is already very long so you have to count one extra 10w cycle. What could be the "excuse" for that? - At the last low we had one missing 10w cycle and now it is appearing in the next 18m cycle. Time likes to adjust in the subsequent cycle if we see longer/shorter/missing cycle - this will not be a surprise.

Pasting the 18m low somewhere... what will be the "excuse" for this scenario? It is nothing new to see cycle making some insignificant low. Usually it means the next longer cycle is dominant making nice bell shape(see the weekly chart) - in this case this is the 4y cycle.
This is known problem with cycles and I was looking for a long time for an indicator showing significant low even if it is not visible on the price. The best one I have found is the McClellan Oscillator and the cycle count reflects NYSE and NYMO.

Jul 24, 2021

Weekly preview

There is no consistent picture across the indices - pattern and cycles look different. Most likely because the markets are making important top and some of the indices are diverging. Extreme cases NDX making new ATH and RUT topping since February.

For the analysis I would rather rely on DJ/NYSE which are not so much influenced by tech stocks like SPX. Based on this indices I would say the 18m low was in June and we are close to the top of another b-wave.
SP500 is distorted version of the same pattern because of all the tech stocks masking the weakness - for the third time we had three days decline retracing one month advance and market breadth looks awful confirming the weakness. This is the last push higher before the upward sloping topping process turns into downward sloping.


TRADING
Trading trigger - buy. More crosses down and up caused by long topping process.
Analysis - sell. Long topping process, which is maturing.

P.S. - for a trade both analysis and trigger should point in the same direction.


TECHNICAL PICTURE and ELLIOTT WAVES
Short term - looks like double zig-zag higher.... probably completing b-wave.


Intermediate term - from the March low we have one big zig-zag consisting of two zig-zags, which itself consist of zig-zags. You can call it W-X-Y, but there is no impulses.
Intermediate term the pattern depends on which index you are watching. NDX looks like impulse completing. DJ a-b- pattern. SPX something in the middle - either distorted version of the DJ's a-b or expanding ED... I have never seen one so probably the first option.


Long term - topping process running for months and maturing. Some kind of b-wave and c-wave will follow.


MARKET BREADTH INDICATORS
Market Breadth Indicators - do not react so far to the move up despite the vertical rally and the new highs, oscillators resetting but this is all.
McClellan Oscillator - reseting ater oversold level.
McClellan Summation Index - sell signal.
Weekly Stochastic of the Summation Index - sell signal and reached oversold level.
Bullish Percentage - in the middle of the range, does not shows signs of reversal.
Percent of Stocks above MA50 - in the middle of the range, does not shows signs of reversal.
Fear Indicator VIX - retracing lower after the spike.
Advance-Decline Issues - bounced up from oversold level. The trend line connecting the lows from 2020 has been broken usually this means the next high marks the top.


HURST CYCLES
Short term cycles - we saw 5w low and now up into 20d high.


DJ/NYSE make most sense of all indices, which is normal not influenced by tech stocks. The sequence high-low works perfect, the length of all cycles is perfect the only "problem" it does not work for NDX:). Alternate scenarios 18m low in May(40w cycle with length 29 weeks) or 18m low later(40w cycle with length more than 40 weeks) This scenarios have statistically lower probability either too short or too long.

P.S. The weekly RSI+MA9 and MCO seem to confirm this hypotesis.

Jul 19, 2021

Long term - update


Next few months should be choppy without a direction, not easy to trade so good luck trading!!!!!!!


Not very clear patterns. I do not see big directional moves in the next 6 months. It seems like trend change from 4y highs/lows to 4y lows/highs and all assets continue to move in sync:
- Stocks - transition from up to down.
- Bonds - higher to complete 18m cycle high then continuing lower
- USD - higher in the next few months.
- Precious metals/miners - not very clear patterns best guess up for the next high part of topping process.
- Crude Oil - correction for several months.


- STOCKS
Intermediate term topping similar to 2000 and 2007 is running. Long term we are seeing 4 year cycle high this year and then expect decline for 4 year cycle low late 2023/Q12024. NYSE showing all the 4y highs since 2000.


- BONDS
We saw the expected 18m low and now moving higher into 18m high. I guess the high should be around September, but if you take the closing high not the spike it could stretch until the end of the year.


- FOREX
EUR/USD - I think this is another 4y cycle high and we should see decline in 4y cycle low. I am not sure about the pattern, it looks like triangle to me at the moment.


- GOLD/SILVER/MINERS
GOLD - long term last year we saw 9y cycle high and I think precious metals should move lower into 9y low late 2023/Q12024 like the stock indices.
It seems the 18m cycle is moving with average length of 16 months and we have two more of them until gold reaches the important 9y cycle low. The rest of the year should be some kind up move for 18 month high currently at month 11 from the last top.


MINERS - similar like gold probably a low in the summer and higher continuing with the topping pattern. Interesting this 9y cycle is counting better as 3x3y cycles, but with the spike lower 2x4y cycles iss working goo too.


- CRUDE OIL
It is time for 18m high, weekly RSI divergence and trend line break, even if you count impulse it is time for correction. So everything points to a correction for a few months.