For two weeks in Bulgaria, no weekly reviews:)
I will to post some thoughts.
Apr 28, 2010
Correction has began / Корекцията започна
With today huge red bar the correction has began. So now we should short the market. First targets DAX ~5900, DJ ~10750.
I think this is just the beginning and we have with very high probability an intermediate-term top. I expect a correction of the whole move since the March 2009 bottom. This will not happen tomorrow of course. We will see first correction of the last move since February. Then "buy the dip" crowd will appear and drive the prices higher. We could see lower higher or higher high I do not know but do not get fooled we are carving out intermediate-term top and you should position right.
Do you remember the sentiment in March 2009? -sell and forget it. Now -buy and forget it. Do not get fooled watch your charts. And I think they are saying troubles ahead. They have warned us in 2009 and they are telling us now the party is over soon.
Look at this charts and the market breadth indicators. Do you notice what happen last time?
- Weekly chart Dow Jones - MACD divergence and 61,8% Fibonacci retracement

- Divergence S&P500 Percent of Stocks above 200 day moving average

- Divergence S&P500 Bullish Percent Index

- Divergence NYSE McClellan Summation index

Apr 25, 2010
Weekly review / Седмичен преглед
I was expecting this week a pullback to begin.... it does not happen, it is not over until its over, right:). I was twice short on DAX shoring the rallies on the small charts, but i have closed the positions at ~6150-6160, because the prices do not want to break the support at ~6140. Nevertheless 100 points profit:) It is not bad playing against the market.
So where are we stand now? - all time frames signal UP, so we must look for long entries. The tricky part is - we are at rising resistance, very extended, very overbought. Every market breadth indicator is flashing warnings. Chasing such market is very dangerous.
For me the smart play now is to play long, but daily trades, do not expect another 1000 points on the Dow. This is my view for now until the market tell me something different.
Looking at the smaller charts, one hour and 15 minutes, I think the indexes have carved out some kind of 4-th wave shallow correction - sideway move on the DAX and a triangle on the Dow. That means we are in a 5-th wave now, but i do not expect it to last very long. Again play long, but daily trades.
And the charts:


DAX hvae broke the rising wedge and now we have a channel

Apr 18, 2010
Weekly review / Седмичен преглед
Hello traders!!!!
freeeeaky Friday ha:) I hope you have not been caught off guard. I have been expecting a pullback to begin for 2-3 weeks... and it has began on Friday.
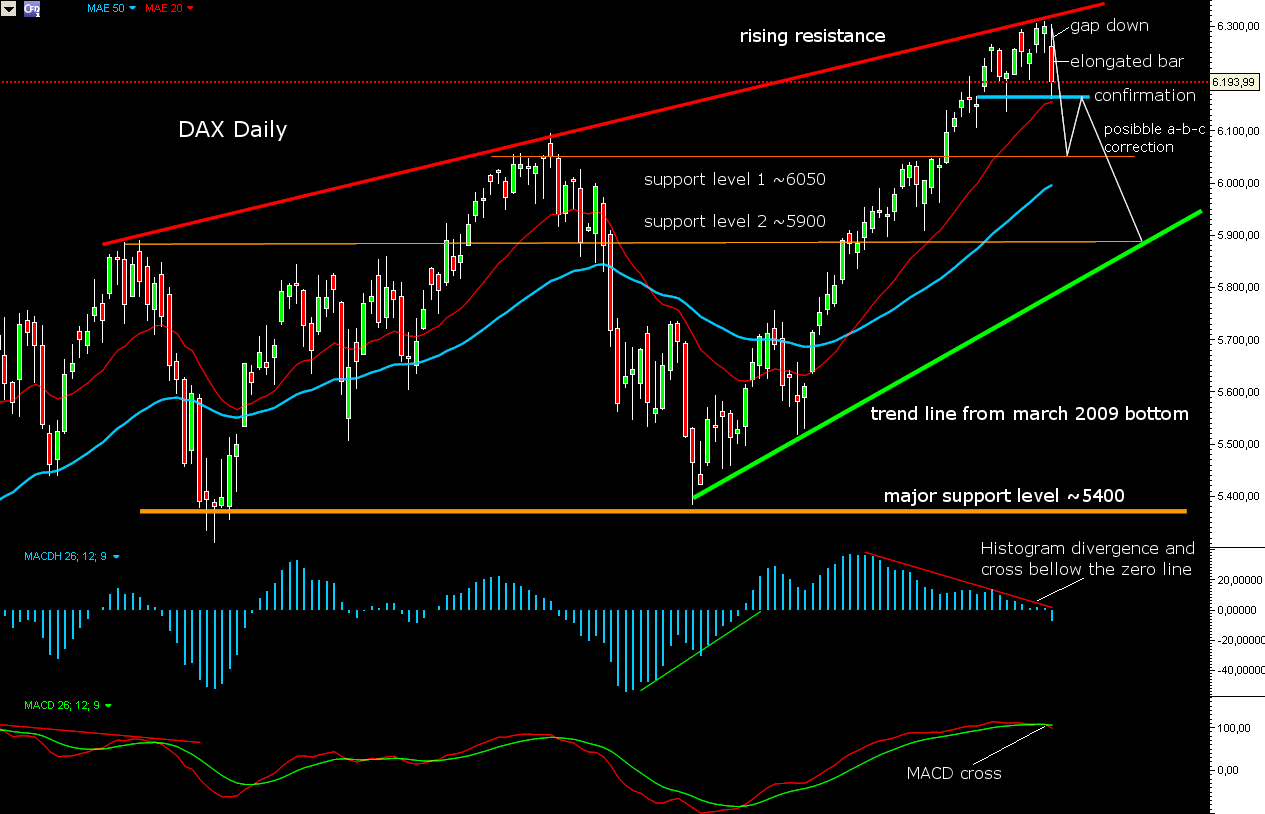
Candlestick - DAX weekly hanging man followed from bearish engulfing, DJ weekly shooting star, DAX daily gap down followed from a long red bar, DJ daily evening star.
Long red bars with very high volume, bearish candlestick formations, market breadth indicators showing extreme bullishness - we have very high probability that a pullback has began.
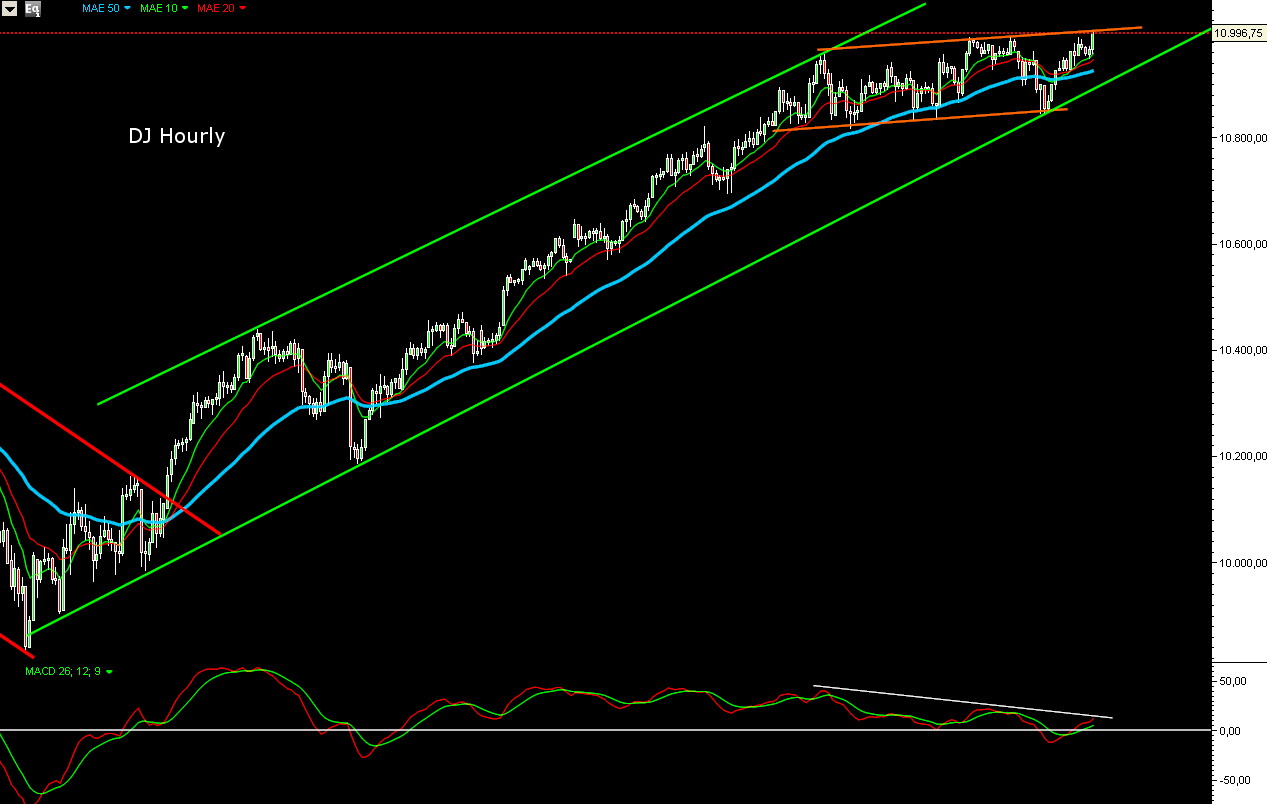
But we still need confirming close bellow the candlestick formation, DJ should break the trend line on hourly chart and make lower low (DAX too). So the move is still not confirmed.
So short-term in the next two to four weeks into mid May, I expect a correction. The move should be just a pullback before we see higher prices July-August.
The big picture:
The bigger picture remains bullish so we should stay bullish and expect this down move to be just a pullback until the market tell us something different.
Long-term trend weekly charts - MACD is above the zero line the prices are above EMA50.
Intermediate-term trend daily charts - MACD is above the zero line the prices are above EMA50.
But be cautious if the move lasts longer then 2-3 weeks and is deeper than 3%-5%, we can see break of the trend lines on the daily charts and the divergences on the weekly playing out, which means at least intermediate-term correction for the whole move from the bottom March 2009.


freeeeaky Friday ha:) I hope you have not been caught off guard. I have been expecting a pullback to begin for 2-3 weeks... and it has began on Friday.
Candlestick - DAX weekly hanging man followed from bearish engulfing, DJ weekly shooting star, DAX daily gap down followed from a long red bar, DJ daily evening star.
Long red bars with very high volume, bearish candlestick formations, market breadth indicators showing extreme bullishness - we have very high probability that a pullback has began.
But we still need confirming close bellow the candlestick formation, DJ should break the trend line on hourly chart and make lower low (DAX too). So the move is still not confirmed.
So short-term in the next two to four weeks into mid May, I expect a correction. The move should be just a pullback before we see higher prices July-August.
The big picture:
The bigger picture remains bullish so we should stay bullish and expect this down move to be just a pullback until the market tell us something different.
Long-term trend weekly charts - MACD is above the zero line the prices are above EMA50.
Intermediate-term trend daily charts - MACD is above the zero line the prices are above EMA50.
But be cautious if the move lasts longer then 2-3 weeks and is deeper than 3%-5%, we can see break of the trend lines on the daily charts and the divergences on the weekly playing out, which means at least intermediate-term correction for the whole move from the bottom March 2009.


Apr 11, 2010
Weekly review / Седмичен преглед
Hello traders!!!!
The past week DJ rose 70,28 points(+0,64%) and DAX 14,14 points(+0,23%).
The big picture has not changed you can see the weekly charts and my longer term view in the previous weekly review from 03.04.2010.
Therefore I will show this week short-term charts - daily and hourly
I have expected higher prices and DJ to hit 11000 - exactly that happened exactly to the point.... what a surprise:)
So we have more and more bearish signs, but the indexes are rising further.... it is not over until its over - it is that simple:)
Look at the charts bellow:
On the hourly charts - prices are rising and they are above EMA50, short-term EMAs EMA10 and EMA20 are above EMA50, MACD is above the zero line(yes developing divergence but still above 0 and rising).
On the daily charts - yes we have possible divergences but there is NOT confirmed bearish candlestick, there is NO confirmation from the short-term charts(hourly).
I expect on Monday (the magic day we always have a rally on Monday) the indexes to close higher, for the rest of the week... it is difficult to predict at this point. My best guess is that the pullback will start next week, but you know - it is not over until its over:) So watch the hourly charts they will tell the story. I have marked on the charts the levels, which will trigger short trade and the most probable targets.
Yes we will see higher prices next week, but long positions are very risky now. Do not get too bullish. The indexes have some room to rise, but they will hit rising resistance(see daily charts) and multi year resistance(see previous week the weekly charts). With this technical picture and market breadth indicators I do not expect a rally. Right now I am on the side line and wait for a short signal. If the indexes rise further... ok but no thanks without me:)
P.S. On the Dow and the DAX the divergences are not so well defined but look at DJ Transportation, Nasdaq and Russell - the picture is much clearer.
Pullback target is ~10550 which is the trend line since the March 2009 bottom, support level from the December range and MA50 - strong cluster of support. If the pullback is very deep second target is ~10250 which is the low level of the December range and MA200.

More than two weeks sideway move carved out channel on the hourly chart. It does not look like a top, so I expect higher prices before the index break through the channel.

Pullback target is ~5850-5900 which is the trend line since March 2009 bottom, the October and November highs and MA50 - again strong cluster of support. If the pullback is deep the second target is the neckline of the reverse Head&Shoulders around 5750.

We could see a Double top or the prices could hit the upper line of the wedge and carve out Head&Shoulders topping pattern at the hourly chart.

The trend on Russell, Nasdaq and DJ transportation looks tired. I think this move is coming to an end.


The past week DJ rose 70,28 points(+0,64%) and DAX 14,14 points(+0,23%).
The big picture has not changed you can see the weekly charts and my longer term view in the previous weekly review from 03.04.2010.
Therefore I will show this week short-term charts - daily and hourly
I have expected higher prices and DJ to hit 11000 - exactly that happened exactly to the point.... what a surprise:)
So we have more and more bearish signs, but the indexes are rising further.... it is not over until its over - it is that simple:)
Look at the charts bellow:
On the hourly charts - prices are rising and they are above EMA50, short-term EMAs EMA10 and EMA20 are above EMA50, MACD is above the zero line(yes developing divergence but still above 0 and rising).
On the daily charts - yes we have possible divergences but there is NOT confirmed bearish candlestick, there is NO confirmation from the short-term charts(hourly).
I expect on Monday (the magic day we always have a rally on Monday) the indexes to close higher, for the rest of the week... it is difficult to predict at this point. My best guess is that the pullback will start next week, but you know - it is not over until its over:) So watch the hourly charts they will tell the story. I have marked on the charts the levels, which will trigger short trade and the most probable targets.
Yes we will see higher prices next week, but long positions are very risky now. Do not get too bullish. The indexes have some room to rise, but they will hit rising resistance(see daily charts) and multi year resistance(see previous week the weekly charts). With this technical picture and market breadth indicators I do not expect a rally. Right now I am on the side line and wait for a short signal. If the indexes rise further... ok but no thanks without me:)
P.S. On the Dow and the DAX the divergences are not so well defined but look at DJ Transportation, Nasdaq and Russell - the picture is much clearer.
Pullback target is ~10550 which is the trend line since the March 2009 bottom, support level from the December range and MA50 - strong cluster of support. If the pullback is very deep second target is ~10250 which is the low level of the December range and MA200.

More than two weeks sideway move carved out channel on the hourly chart. It does not look like a top, so I expect higher prices before the index break through the channel.
Pullback target is ~5850-5900 which is the trend line since March 2009 bottom, the October and November highs and MA50 - again strong cluster of support. If the pullback is deep the second target is the neckline of the reverse Head&Shoulders around 5750.

We could see a Double top or the prices could hit the upper line of the wedge and carve out Head&Shoulders topping pattern at the hourly chart.

The trend on Russell, Nasdaq and DJ transportation looks tired. I think this move is coming to an end.


Apr 6, 2010
Tuesday update
As i have expected 5-th wave is developing. DJ is slightly above 10960. We will hit 11000 that is sure:)
Apr 3, 2010
Weekly review / Седмичен преглед
Lets look at the big picture first - the weekly charts.
The big picture remains bullish. The prices are above EMA50 and MACD is above the zero line. The histogram is above the zero line and its slope is pointing higher.
But do not be too bullish. Lets look at the charts closer.
The indexes are now in a congestion zone between support and resistance levels developing divergence - you can see this on the charts bellow. You must be very cautious when you see divergences on weekly charts its very important signal.
RSI broke its trend line in January, which means the up move since March 2009 is over.
The up move is over does not necessarily mean the trend is over. There is bullish and bearish scenario:
- Bullish scenario - expect correction. The prices will move sideways in this congestion zone for some time and work out the divergences.
- Bearish scenario - expect trend change. The trend is changing and the indexes will carve out a top in the next several months.
I think the action bullish or bearish will develop between now and the end of August and then we will know which camp is winning the battle. Now is time be cautios and use the daily charts to squeeze profits.
P.S. Do not get emotionally committed to the bear or the bull camp. I am reading blogs in Internet and different predictions - forget the gurus some of them predict Armageddon other new bull market. In the market there is two direction some one will be right:)) then they will tell you how great they are - I will say bullshit. The truth is no one knows the future. So watch the charts and have both scenarios in your head.

DAX - RSI broke its trend line and now it is testing it. RSI is still bellow the 66 level which means we are still in a larger down trend.

DAX is up 115 point or 1,89% for the week and DJ 76 points or 0,71%.
I have been expecting pullback the last several weeks.... I did not happen:). This is not bullish for me. This up move lasts almost two months already without healthy pullback hitting resistance levels on the weekly charts... again this is not bullish for me.
The prices continue to move higher, but the oscillators and market breadth indicators are becoming more bearish.
- NYSE McClellan Oscillator is bellow the zero and NYSE McClellan Summation index crossed its EMA5
- SPX500 and NASDAQ - we have MACD cross and the Histogram is bellow the zero line, but DAX and DJ MACD still have not crossed its signal line.
Look at the daily chart - the Histogram is moving lower and RSI(5) shows divergence. Daily charts are sending us a message that this move is coming to an end.
(Long signal if DJ breaks above 10960, but short-term 1-3 days. Close bellow the base around 10820 says the top for this move is in.)

Look at now the hourly chart of Dow Jones 30 - the prices are correcting seven sessions sideways building a base. This price behavior is typical for 4-th Elliot wave some kind of triangle or flat correction. Prices are staying above EMA50, MACD above the zero line, Slow Stochastic says we have a correction not a top.

So lets summarize - we have conflicting signals on daily and hourly charts. The indicators are deteriorating on daily charts, but prices are correcting sideways and the signals on the hourly charts are still bullish.
What should we expect?
In such a situation the larger time frame will sooner then later prevail, but it takes time the signals on the charts of lesser degree to play out.
I expect to see higher prices 5-th wave early next week and then the daily indicators to play out bringing correction for this move which last already two months. Possible targets - DAX 5850-5900, DJ ~10500 (see the charts from the previous week).
Subscribe to:
Posts (Atom)
