Trading trigger - buy signal.
Analysis - final wave completing the correction and turn lower to complete the 4y cycle low. At intermediate term high now topping process during the holidays.
P.S. - for a trade both analysis and trigger should point in the same direction.

TECHNICAL PICTURE and ELLIOTT WAVES
Short term - looking at other indices the pattern is double zig-zag w-x-y alternate simple zig-zag a-b-c.

Intermediate term - two very similar moves including indicators. The bigger pattern is flat.

Long term - 4y cycle high the end of 2021, now a-b-c lower into 4y cycle low in Q1 2024. Very long term - most likely huge double zig-zag from the 2009 low. If we are lucky this is lower degree b-wave(green) and there is one more high. If not multi year decline has started.

MARKET BREADTH INDICATORS
Market Breadth Indicators - very overbought some with divergencies.
McClellan Oscillator - ovebought with double divergence.
McClellan Summation Index - buy signal, double divergence.
Weekly Stochastic of the Summation Index - buy, signal, overbought level reached.
Bullish Percentage - overbought.
Percent of Stocks above MA50 - overbought.
Advance-Decline Issues - could not reach overbought level, double divergence.
Fear Indicator VIX - tripple low?
HURST CYCLES
Short term cycles - at 20d cycle high at week 20 so this should be 20w high... if not we have extended 10w/20w cycles with one more 20d cycle to go.
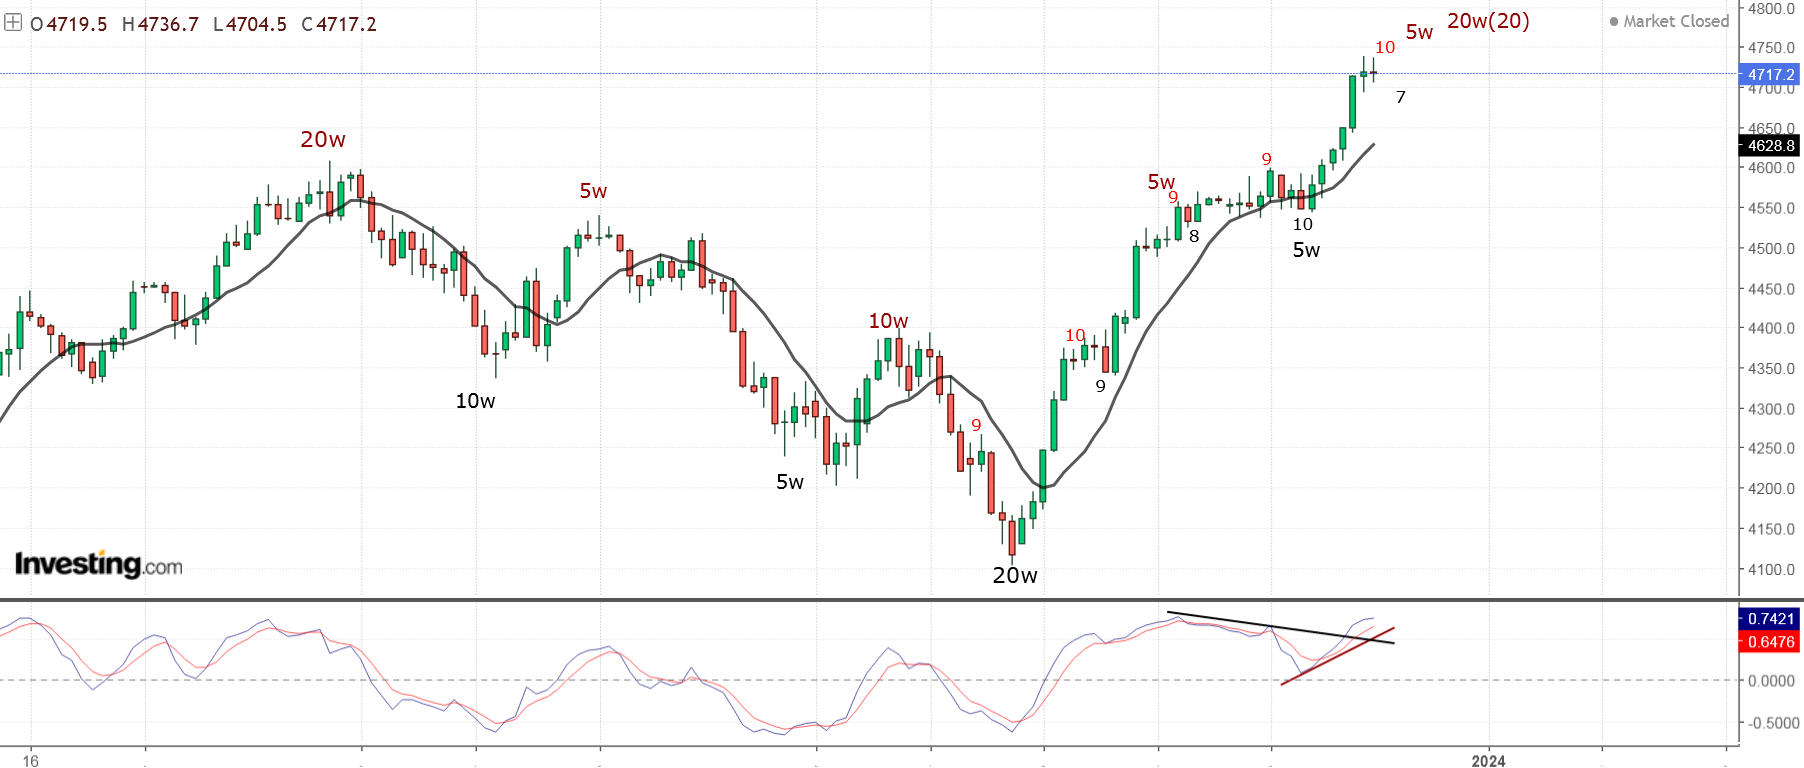
Week 7 for the 20w cycle. Rising into 20w cycle high currently at week 20 discussed above.
Long term the previous 4y cycle high is repeating - 3x40w cycles/two years for mid-cycle high(2018-2019 / 2022-2023) and down into 4y low.


Some asked about the DAX this pattern fits the best - https://invst.ly/12ouy7
ReplyDeleteDecline to around 13500 should be the next move.
looks like another ATH in DAX. SPX also? 4850?
DeleteWe are close. Monthly bb 4760, then all the Bbs (daily weekly and monthly) will be hit, which is exactly what happened at the October bottom of 2022.
ReplyDeleteNDX is more clear for the last 5w high, so I expect a last 20d high next week
ReplyDeleteVideo from someone who was inside the financial system - https://www.youtube.com/watch?v=dk3AVceraTI&t=4s
ReplyDeleteNothing new for me, just confirming what I expect... maybe be some sheeple will watch it and wake up.
What is December 2018 was 4y low and Ocotber 2022 too?, in NDX is possible
ReplyDeleteNo 2018 is not the low even for NDX, and NDX is not the market. You should do exactly the opposite look at the other indices and ignore NDX.
Deletesentiettrader thinks like me
Deletesentiettrader has no clue what he is talking about.... zero knowledge about patterns and clueless like in 2019.
DeleteWhy do you think I did not stop calling 2019 just correction to be fully retraced? Why did 2020 melt down occurred? Maybe I was lucky and 30% decline occur all the time....
Deletesentiettrader is just another "expert"-disappointment. I stopped watching his videos long ago.
For swing trading price touched/crossed FLD or projection is ok but if you expect to show you pattern, trend change - good luck with that.... understandable all he can do is trying to interpret lines drawn by a software.
He's got a great accent though
DeleteKrasi. would you be able to do a hourly chart of SPX project for this week movement?
ReplyDeleteSuch forecast is useless it will be wrong...
DeleteSPX hourly charts currently show across-the-board bearish divergences vs. all indicators/oscillators. So SPX should get a slap-down to ~4,540 - 4,600 neighborhood sometime soon, and thus setting up the same scenario for the daily chart down the road, and then the weekly. The usual glacially slow round-topping of this cycle.
Deletehope you are right one of these times
DeleteNow there is something to analyze - https://invst.ly/12q8le
DeleteThere's your "slap-down," Anonymous.
Delete13 december was 20d high and 14 20d low?
ReplyDeleteLow on 15th the futures early on 18th see the comment above the triangle.
Deletein dax more clear, 15th high, 18th low?
Deleteno, sorry, 14th high and 18th low
DeleteKrasi, from 14000 to 16000, there is a bull flag and abc so ndx to 18ooo
ReplyDeleteNo interested to analyze someone's unclear analyzes.... bull flag 18ooo!?!?!?
DeleteMy analyzes are above 20 week high next is decline into 20 week low two months.
Krasi, information like MMF (https://www.ici.org/research/stats/mmf) decrease going into stock market will further push market up. how does this fit into the crash you are talking about?
ReplyDeleteIf you have statistically/historically significant correlation please share. If not it is useless to comment someone's speculation about something.
Delete"MMF decrease going into stock market will further push market up" - prove this is important and it works - until than my comment is funnymentals means shit for trading.
Don't you think about rotation, the Russel goes up from a long period of stamping so, no recession and maybe we didn't see the end of the bull run
ReplyDeleteAnd there is a small channel to 17300
ReplyDeleteThe last movement looks impulse
ReplyDeletePlease write one post....
ReplyDeleteWhat I think is above. This is clear corrective move accept it and live with that.
I will not confirm your fantasy.
we can see a drop next week around 3-4% for 10w low and a last high the first week of January ?
ReplyDeleteYes, something like that
DeleteCovid 2.0 will come to save the day for the bears - don't stress!
ReplyDeleteThere is always some excuse so I do not worry at all...
Delete4709 supported?
DeleteSupport is at the 4550-4600 area.
DeleteThe simple zig-zag playing out - https://invst.ly/12qu9k
ReplyDeleteIf completed, how far should it retrace? Down to "b" before one last push higher?
DeleteInitially should be down to support 4550-4600.
DeleteKarsi, it has started!! how deep is this drop?
ReplyDeleteK-R-A-S-I
DeleteFirst to support... later we will see what happens.
DeleteCould be this low a 5w low very long from October lows?
ReplyDeleteNo, this is decline into 10w low.
DeleteDumb money flowing into sp500 ETFS at record levels
ReplyDeleteYes, for months
Delete100 year high
ReplyDeleteLOL. Tulips for sale ... anyone?
Delete20w high.
ReplyDeleteCan we see new highs if it is 10w low and before going to 20w low ?
ReplyDeleteKarsi, the SPX is not going down. it is frustrating to look at it holding up. any chance it will go down more?
ReplyDeleteYes, but after the holidays - 10w low in the next 1-2 weeks bounce then the bigger decline.
DeleteA 20d high cycle more will look better
ReplyDeleteThis seems only 20d high and low
DeleteThis is already day 51 for the 10w high - this is the length for extended cycle.
DeleteAnother 20d cycle will mean 60+ days - I have not seen such... this is already 12 weeks it does not make sense.
i think the 10 week low may be next wednesday dec 27 and around 4650-4700 ES. we'll see.
ReplyDeleteJP
it could also come as early as tomorrow friday if we have a good flush down..
DeleteJP
4800 looks like the goal unless today was abc, I guess it could be
ReplyDeleteRoberto, can you show in a chart what you think the moves are? why 4800 is the goal?
DeleteIt seems this is either a 4th wave or 1-2 of an ending diagonal. That's my opinion, next week may be lower but I don't think it's topped.
DeleteKarsi, not again, grinding higher today again!?!?! what the heck?! how long is this gonna go?
ReplyDelete