Trading trigger - buy signal.
Analysis - the indices turned lower to complete the 4y cycle low. Intermediate term - possible low, but something does not feel right.
P.S. - for a trade both analysis and trigger should point in the same direction.

TECHNICAL PICTURE and ELLIOTT WAVES
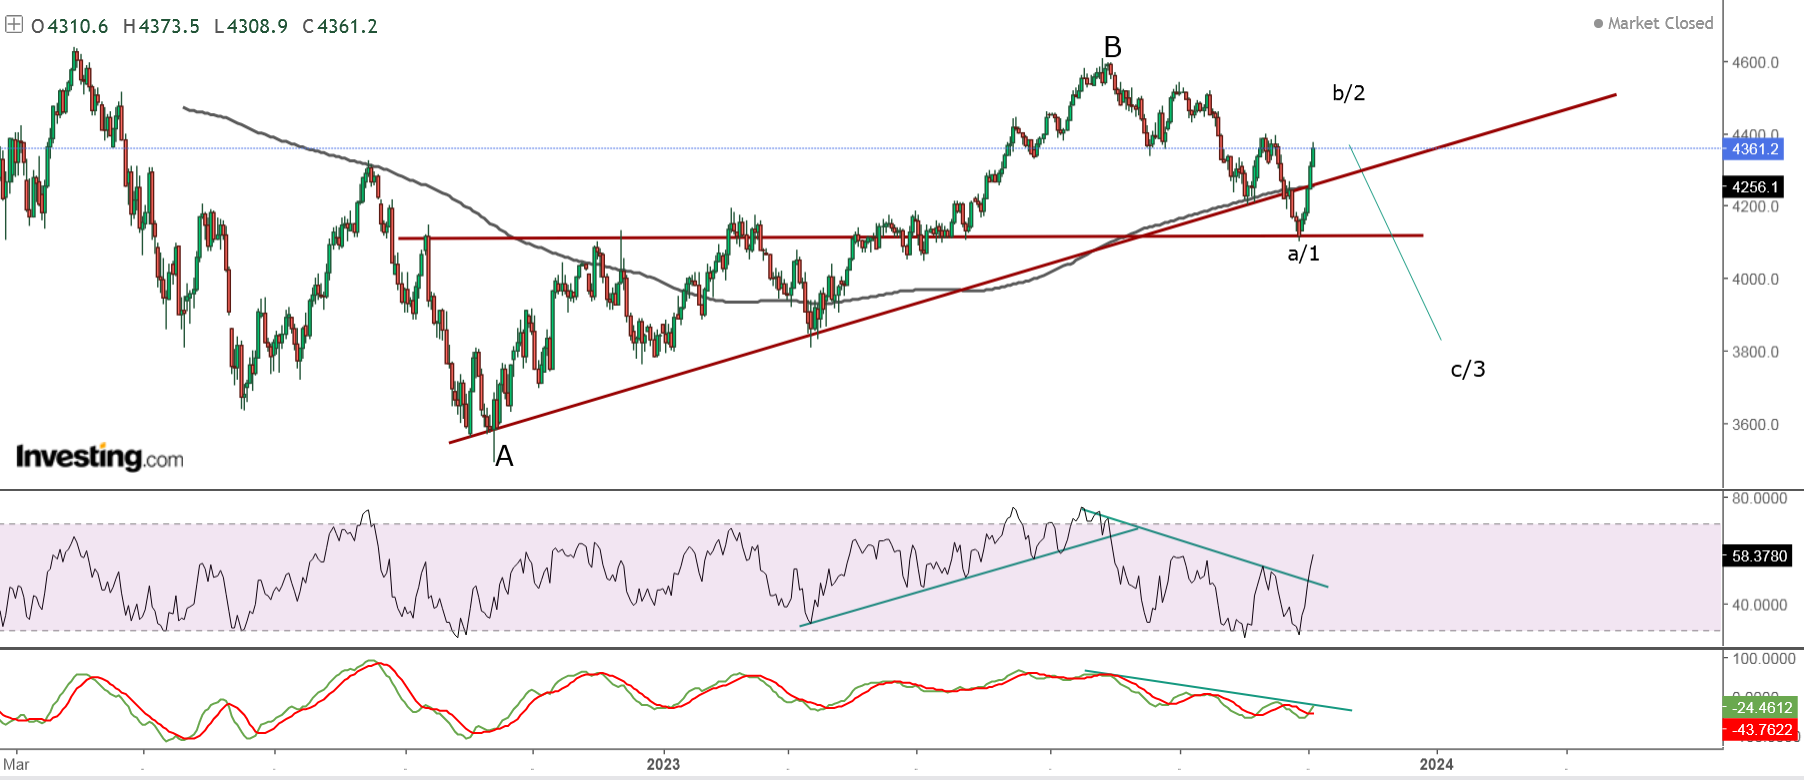
Short term - completed w-y-z or impulse which breaks the rules. The "surprise" pattern zig-zag lower a-wave, expanded flat b-wave and another zig-zag lower.

Intermediate term - a low at the support area and b-wave running, or one more decline c=a to the next support area around 3900 MA200 weekly.
Long term - 4y cycle high the end of 2021, now a-b-c lower into 4y cycle low in Q1 2024. Very long term - most likely huge double zig-zag from the 2009 low. If we are lucky this is lower degree b-wave(green) and there is one more high. If not multi year decline has started.

MARKET BREADTH INDICATORS
Market Breadth Indicators - turned higher.
McClellan Oscillator - touched overbought level.
McClellan Summation Index - buy signal.
Weekly Stochastic of the Summation Index - buy signal.
Bullish Percentage - turned higher.
Percent of Stocks above MA50 - turned higher.
Advance-Decline Issues - turned higher, in the middle of the range.
Fear Indicator VIX - turned lower.
HURST CYCLES
Short term cycles - higher for 20d high as expected, this should be 5w cycle high in the next few days - in this case we should see turn lower into 5w cycle low.

Week 16+1 for the 20w cycle. Possible 20w low, I have some doubts because of the pattern - lets see if we have confirmation next week.


With the right perspective it is easy to understand the events and what follows next. There is questions what is going on... it is simple the old world from the 20th century is dead and in 10 years a new one will emerge. The fight is how it will look like.
ReplyDeleteThe so called democracy is just a theater for the masses, illusion that you have a choice - the ruling elite does not need it anymore.
The so called capitalism is dead for a long time, the financial system is bankrupt - the ruling elite needs a reset, but to blame it on something else.
They want to replace it with totalitarian regime and they need - total control(digital ID and currency etc.), crisis after crisis creating chaos,destruction,desperation,fear until you give up.
At the end they will sell you their shit for cake and you will beg for it - guess how it will gone a happen.
I have wrote about this in 2018, the process has been started in 2020 and I guess it will accelerate around the elections at the end of next year.
There is no good or bad guys USAvsRussia or USAvsChina all this fight is part of their game they all play together. It is us versus them, common people against elites. Time to wake up.... free people or slaves on digital leash.
Everything is cycles and patterns, the fourth turning is running and it will get worse not better - https://www.youtube.com/watch?v=8Yfb2zQjKWE
Thank you Krasi for sharing. What can a common man do (related to finances or anything else) to survive the chaos and be ready for what is coming.
DeleteI wish I knew the answer:) maybe avoid the big cities, be part of a community to support each other, think about alternative sources of food and energy not to be totally dependent... and pray to God.
DeleteFinances - they will take full control bank/brokerage accounts... you can forget them if you do not comply. You will control only what you have in your pocket - cash and gold, this is what you should have... and a house with vegetable garden:)
Why alternatives sources of energy and food? Because inflation will run high? Or to reduce dependency?
DeleteWhen a new system is supposed to emerge, there should be optimism. :) But looks like you think it's a doomed system not favorable to most.
DeleteKrasi, why are great American cities crumbling? I recently heard Nayib Buckele point out that so many people cannot be stupid and be taking dumb decisions. He says it's coordinated and intentional. Why is the question?
Deleteanon1 - everything dependency, high prices, much less choice because of broken supply chain.
Deleteanon2 - I am optimist the bad guys will lose, they are doomed and something better will emerge but it will take time... after 2035 we will see light in the tunnel.
Quelle est votre vision sur le pétrole ? Jusqu'au ira la baisse ? Objectifs de long terme ?
ReplyDeleteThe same like the indices - lower to complete the decline from 2022 then higher.
DeleteMax decline should be to 45, more likely 55.
Long term is complicated higher for a few years, lower for a few years and major low 2030-2032.
Don't you think we have a bull flag or cup and handle?
ReplyDeleteLook at HYG, TLT, they are going up, TNX and the dollar going down, that why the market is going up, the fed finish to raise itrest rat
ReplyDeleteIf it's a C so the bear trap to 4100 was B?
ReplyDeleteKrasi, is it can be the down trand 5 wave of wave 1
ReplyDeleteWave 1 like diagonal?
ReplyDeleteNo it is cup and handle.
Deletecup and handle within a wave 1 diagonal:)
DeleteJP
If June was 40w low, I think 27 July was 5w low and also 25 August, 3 October and 27 October, so 20w low.
ReplyDelete27 July 5w high too, so in 1-2 weeks 20w high
"Team Transitory" still pulling the strings.
ReplyDeleteKarsi, what do you mean cup/handle? are you super bullish from now on? no more 3500 or so anymore?
ReplyDeleteI am joking with LadyS
Deletechart shows lower than 4500 on intermediate term...now what?
ReplyDelete