Trading trigger - buy signal.
Analysis - final wave completing the correction and turn lower to complete the 4y cycle low. Intermediate term low and higher for a few weeks, probably into year end.
P.S. - for a trade both analysis and trigger should point in the same direction.

TECHNICAL PICTURE and ELLIOTT WAVES
Short term - completed the zig-zag, more likely part of a double zig-zag.

Intermediate term - there is two options w2 of C(very low odds) or e-wave completing the B-wave.
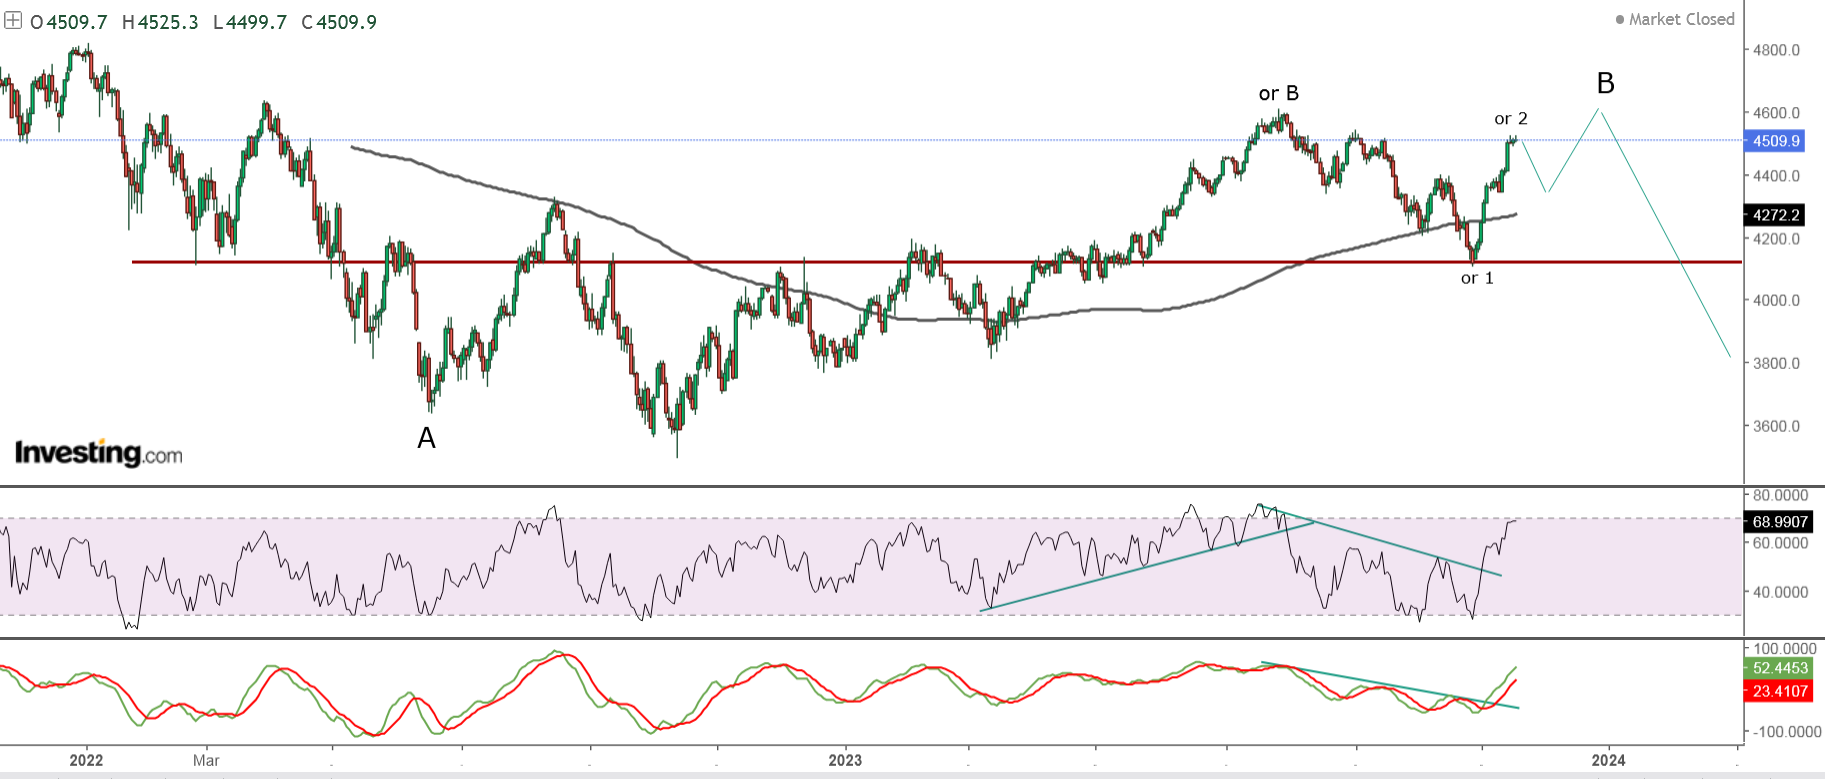
Long term - 4y cycle high the end of 2021, now a-b-c lower into 4y cycle low in Q1 2024.Very long term - most likely huge double zig-zag from the 2009 low. If we are lucky this is lower degree b-wave(green) and there is one more high. If not multi year decline has started.

MARKET BREADTH INDICATORS
Market Breadth Indicators - moving higher, in the middle of a move... not a top.
McClellan Oscillator - second lower high.
McClellan Summation Index - buy signal.
Weekly Stochastic of the Summation Index - buy signal.
Bullish Percentage - moving higher.
Percent of Stocks above MA50 - moving higher.
Advance-Decline Issues - moving higher.
Fear Indicator VIX - testing the low.
HURST CYCLES
Short term cycles - third 20d cycle completing the third extended 5w cycle. Next should be decline into 5w low.
Either we have average 20w cycle high consisting of 3x5w extended cycles or we will see one more 5w cycle for extended 20w cycle.

Week 3 for the 20w cycle. Rising into 20w cycle high currently at week 16 discussed above.
Long term the previous 4y cycle high is repeating 3x40w cycles/two years for mid-cycle high(2018-2019 / 2022-2023) and down into 4y low.


looks clear to understand, zero possible misinterpretation here - - turn down to 4350 should be any day now
ReplyDeletePathetic as usual...
DeleteImminent collapse coming …4600?!
DeleteAnother moron trying to look smart.... do you think you are first one. I have seen hundreds like you....every two years at the tops. Do not worry you will have the same destiny - going down the drain donating your money to the wall street crooks.
DeleteKrasi look at the ndx , don't you think it's the 5 wave, it's going to 17000?
ReplyDeleteWhat is this number based on? Rhetorical question - on nothing just throwing round numbers around that is what clueless bulls do. Look at the possible patterns and start measuring with Fibo ruler.
DeleteI will throw a number too 16700-16750
Or it's C Wave and we finished
ReplyDeleteNot likely
DeleteLady calling the top, watch the f out
ReplyDeleteOr you calling for a cliff
Delete17000 it's channel
ReplyDeleteWe are in a positive period
ReplyDeleteBut negative divergence, weekly chart
ReplyDeleteWhich channel this one - https://invst.ly/12d9n5
DeleteThis is not a reliable target, tops do not reach the upper channel.
In Lady's world, "channel" = canal, whatever that is.
Deletekarsi, this mad bull is crazy strong, how the ending is going to look like? can hit 4600?
ReplyDeleteI do not know where you see strength and mad bull
Delete- a few stocks with heavy overweight NDX/SPX is not a bull market
- the same few stocks in terminal pattern with divergences at the weekly chart
- very week market breadth compared to the previous highs
To the question - first pullback then above 4600
Behind The Rally: The Two Largest Weekly Buybacks On Record
DeleteSo much for the strength...
Yesterday 5w low?
ReplyDeleteNo, the low of the correction will be the 5w low.
DeleteAbove 4600, it's say we didn't finish B wave, then the NDX will go to a new ATH
ReplyDelete