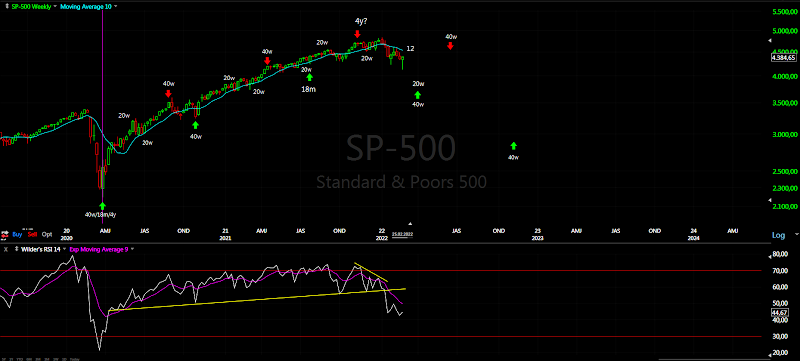
The war scare caused a lower low. The pattern changed some what, but not the overall picture.
From cycle perspective it makes more sense if the 18m low was in July and now we are 5w cycle away from 40w low. I do not think we have another 3 months lower.
Market breadth is getting oversold and it is more likely that the indices are nearing intermediate term low than just starting lower for another 3 months.
Overall it confirms my suspicion from the last two weeks that we saw the high in November. Currently I think we should see higher for a week to complete at least 10w high and one more low for 40w low.
TRADING
Trading trigger - buy signal, in a few days we should see a high.
Analysis - long term sell the rips, I think we have major top which will be tested one more time. Intermediate term - expecting a low in a few weeks and higher for 2-3 months.
P.S. - for a trade both analysis and trigger should point in the same direction.
TECHNICAL PICTURE and ELLIOTT WAVES
Short term - I think the top is behind us, but the pattern is not more clear. According to the cycles there should be one more low to mark the end of this decline and intermediate term low. The question is if we saw B or not.
Intermediate term - I see W-x-Y(yellow) with complex double zig-zag for Y=W, alternate we have Z-wave(red).
The price have problems to move above MA50/MA200 and the middle trend line has been broken - probably the lower trend line will be tested. Waiting for another week to see where to put the b-wave.
Long term - topping process running for months and maturing. Some kind of corrective wave b-wave and c-wave will follow.
MARKET BREADTH INDICATORS
Market Breadth Indicators - I have the impression that the indices are nearing intermediate term low.
McClellan Oscillator - around zero and divergence.
McClellan Summation Index - sell signal, in very oversold teritory.
Weekly Stochastic of the Summation Index - sell signal, reached oversold level.
Bullish Percentage - heading lower.
Percent of Stocks above MA50 - touched oversold level and turned up.
Fear Indicator VIX - looks like double top.
Advance-Decline Issues - preparing for divergence.
HURST CYCLES
Short term cycles - it looks like we have the expected 5w low and heading higher in 5w/10w high.
Week 12 for the 20w cycle(for the case with 18 low in July).
Long term the indices are at 4 year cycle high. The 18m low either late September with one extra 20w cycle or alternate on time in June/July... waiting to see how the pattern will play out to confirm one of the two options.
With the current price action it makes more sense if the 18m low was in July and now heading into 40w low. I expect highs echo from 2018.
Another try to combine pattern and cycles and make sense of the mess this time NYSE
Subscribe to:
Post Comments (Atom)


Thank you so much. You think gold has finished it's 2 wave from 2020 top and now 3 coming down next?
ReplyDeletec-wave there is no impulses.
DeleteWe bottomed. News is super pessimistic rn. Alot of puts bought, and people positioned short. We will go up until Summer, and that will be the final top!
ReplyDeleteNor very likely, cycles are telling different story first one more low then up in the summer.
DeleteDays away from 10 week high - https://invst.ly/xjv01
Looks like today is the day
DeleteOil?
ReplyDeleteWe have never had a major top on a news event.
ReplyDelete