Trading trigger - sell signal.
Analysis - long term sell the rips. Intermediate term - important high completed the correction from the October low.
P.S. - for a trade both analysis and trigger should point in the same direction.

TECHNICAL PICTURE and ELLIOTT WAVES
Short term - possible impulse 1/a lower or just another w-x-y we will know more next week.

Intermediate term - some kind of w-x-y/B or a-b-c/B - at the end only the labels are different. Probably the price will find support around MA50.

Long term - most likely huge double zig-zag from the 2009 low. If we are lucky this is lower degree b-wave(green) and there is one more high. If not multi year decline has started.

MARKET BREADTH INDICATORS
Market Breadth Indicators - pointing lower with sell signals.
McClellan Oscillator - below zero.
McClellan Summation Index - sell signal.
Weekly Stochastic of the Summation Index - sell signal.
Bullish Percentage - pointing lower, below 70.
Percent of Stocks above MA50 - pointing lower, below 75.
Fear Indicator VIX - correcting lower.
Advance-Decline Issues - pointing lower, in the middle of the range..
HURST CYCLES
Short term cycles - it looks like 5w low to me.
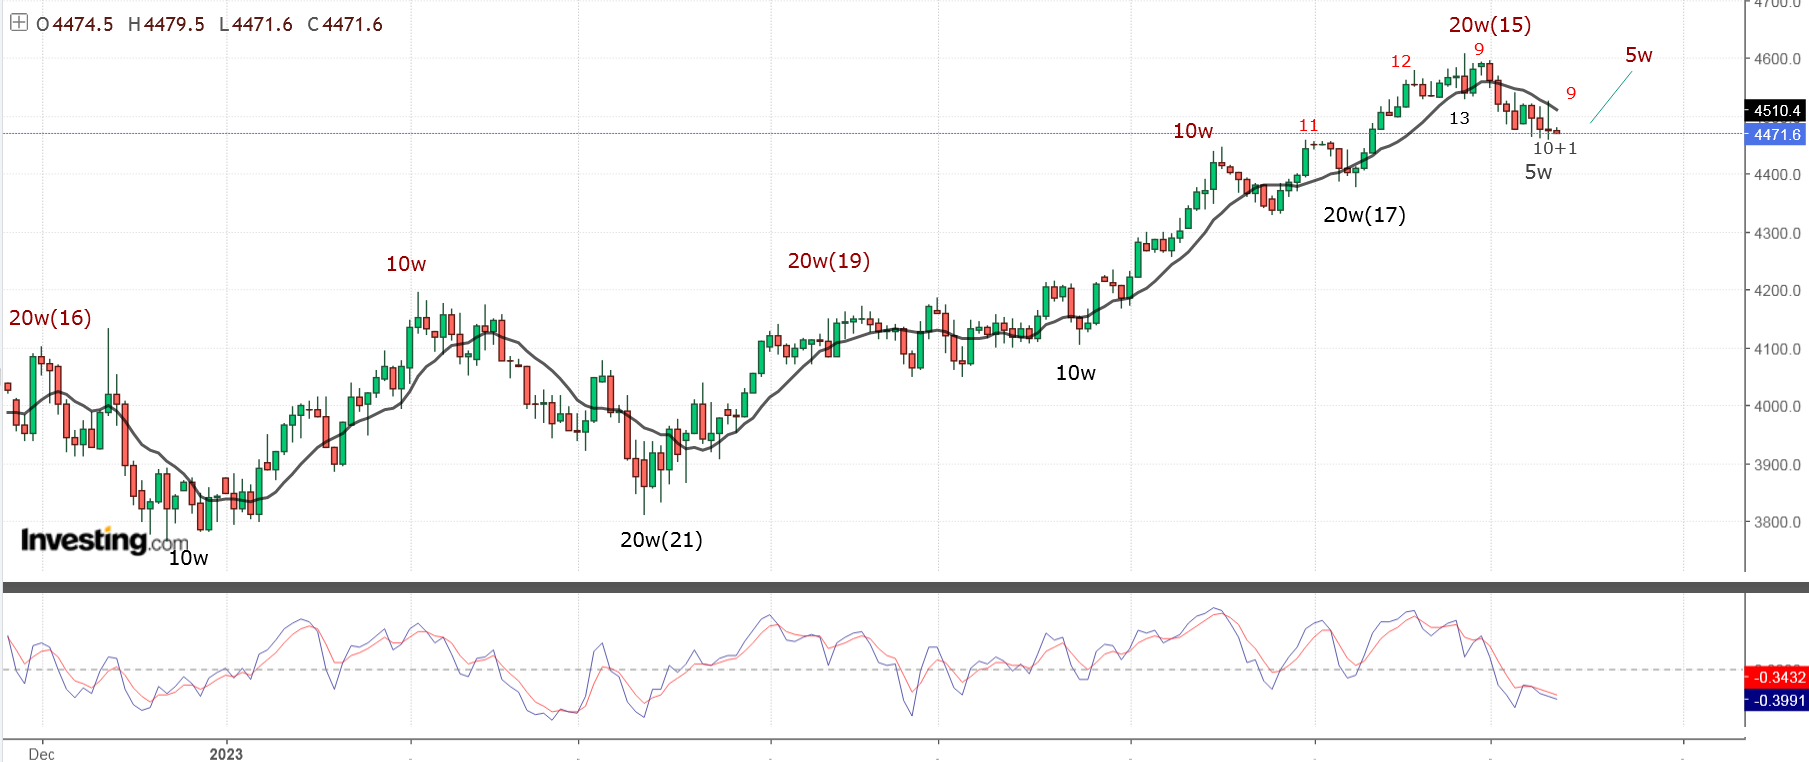
Week 5 for the 20w cycle? We do not have clear cycles:
- if I stick to the average length we have 10w/20w cycles shown on the chart above. In this case the next 20w cycle is running, it is around the low of the first 5w cycle with three more to go. There is no clear 40w cycle low, it happens when the cycle of higher degree is dominant - the 18m cycle.
- counting important highs/lows - in this case we have very long 20w cycles and the next low should be this or next week.
- the 4y cycle high consisting of 2 cycles instead of 3x18m cycles like the previous one.


I like the down move to get everyone short late Monday or Tuesday and then a big rally to cover and explode up. Should make bulls feel fine at the lower high. Let's see. Thanks Krasi
ReplyDeleteAnything is possible, however from above, as Krasi stated "we have very long 20w cycles and the next low should be this or next week." This is what I'm looking for.
DeleteIsn't that what I wrote
DeleteWhere are all the bulls
ReplyDeleteWait for the next move up, now they are confused and a little bit scared.
DeleteIf they are scared and confused how's it going back up? You make no sense
DeleteThe retail traders are moving the market - seriously???
DeleteIs this a Y now Krasi going by your short term chart?
ReplyDeleteIt counts better like this - https://invst.ly/113635
DeleteKrasi, any thoughts you might share on TLT's recent butt-kicking, and therefore mid- to long-term prospects for US rates on the horizon? Thanks much.
ReplyDeleteDouble bottom on bonds looks promising
DeleteMy exact prognosis as well - on monthly TLT chart, retest of October '22 bottom, setting up nicely for bullish divergence vs. indicators/oscillators. I bet a similar scenario on the daily chart as well for more precise timing for entry/long.
DeleteAnd the US Dollar (via UUP) doing the exact opposite of above.
DeleteAnd gold (GDX) and yen (FXY) following TLT's lead .... ? SO many long-term opportunities/trades.
DeleteCan you clarify what you mean? Not sure what you are trying to say .
DeleteTLT is clearly higher it has to complete 4y high, the pattern lower is corrective anyway.
DeleteThanks for your input, Krasi.
Delete"Anonymous", pick up a copy of Elder's "Trading For A Living"
DeleteShort term low today Krasi?
ReplyDeleteFor me short term is 20d cycle low and I think this is not the low.
DeleteSo what's the new Neely count
ReplyDelete