Trading trigger - sell signal.
Analysis - the indices turned lower to complete the 4y cycle low. Intermediate term low expected in a week or two.
P.S. - for a trade both analysis and trigger should point in the same direction.

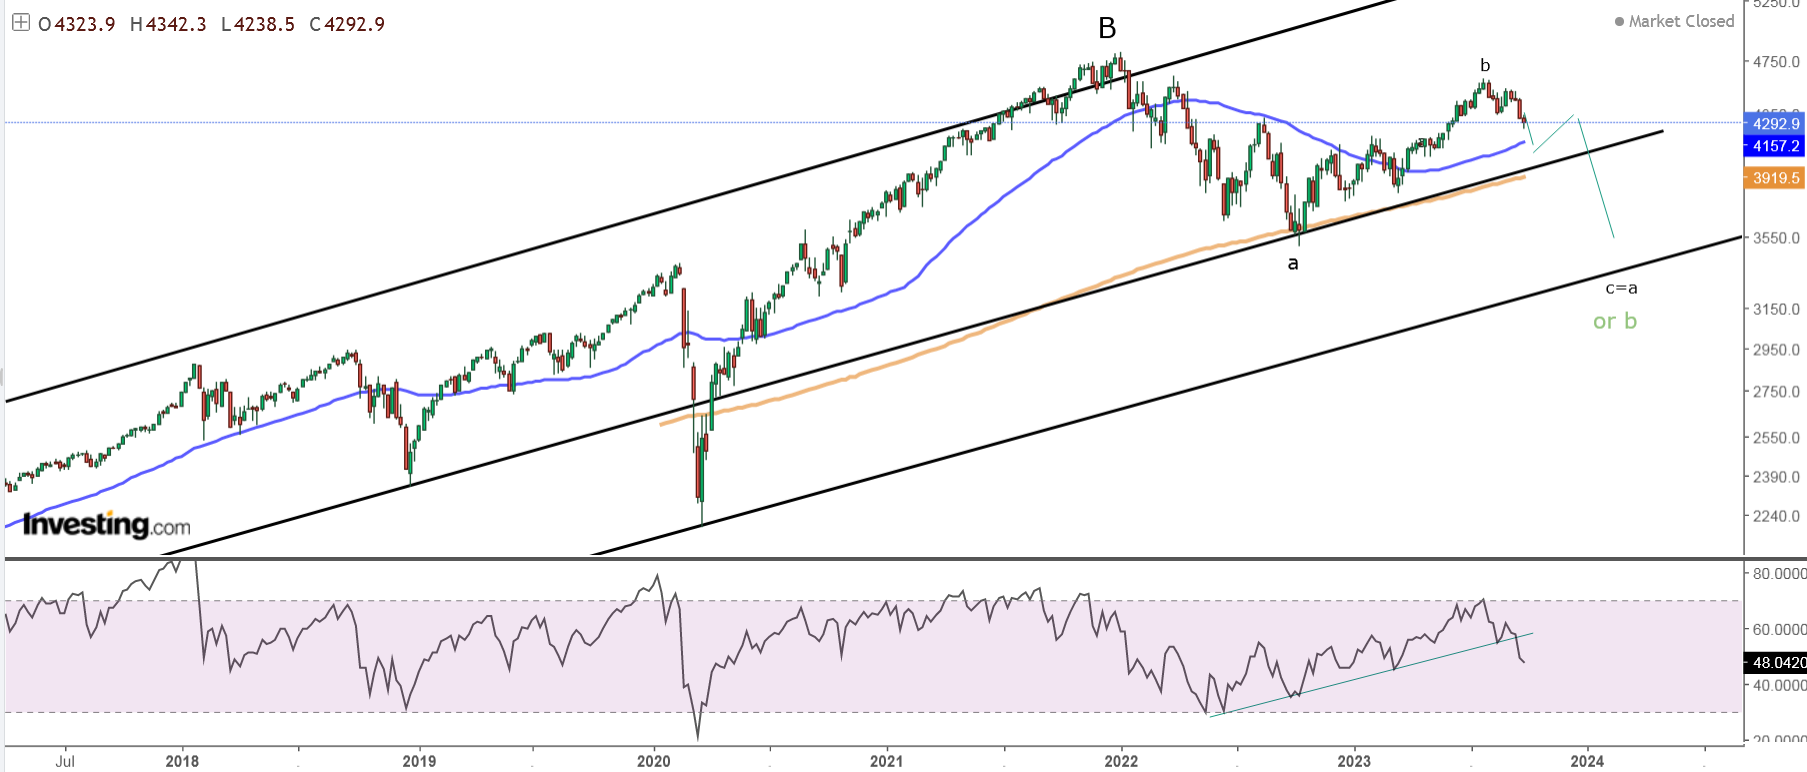
TECHNICAL PICTURE and ELLIOTT WAVES
Short term - this bounce could be over, or it could be sideways pattern too early to say. Alternate the whole move lower is over, but one final decline looks more likely.
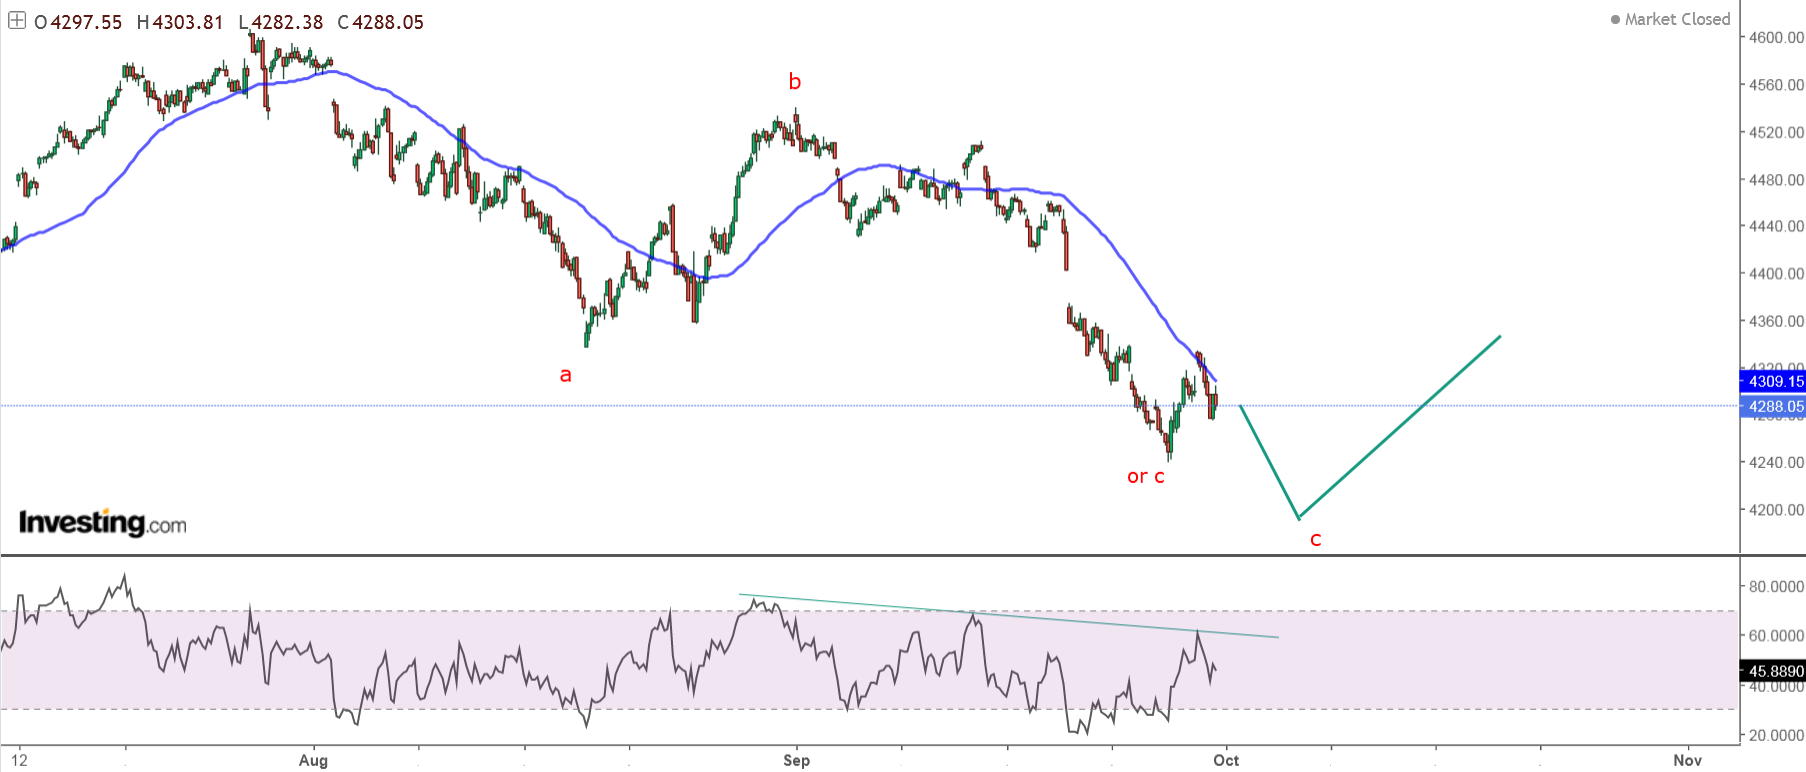
Intermediate term - a-b-c lower and 20w low expected. Look at the area around 4150 it has been tested so many times and it is the cross point with the trend line - such levels attract like magnet the price.

Long term - 4y cycle high the end of 2021, now a-b-c lower into 4y cycle low in Q1 2024. Very long term - most likely huge double zig-zag from the 2009 low. If we are lucky this is lower degree b-wave(green) and there is one more high. If not multi year decline has started.
MARKET BREADTH INDICATORS
Market Breadth Indicators - still negative, no signs of a bottoming.
McClellan Oscillator - around zero.
McClellan Summation Index - sell signal.
Weekly Stochastic of the Summation Index - sell signal.
Bullish Percentage - moving lower.
Percent of Stocks above MA50 - oversold level.
Advance-Decline Issues - pointing lower.
Fear Indicator VIX - looks like double bottom.
HURST CYCLES
Short term cycles - pop higher for 20d high which should be 10w high then final 20d low and 20w low.

Week 18 for the 20w cycle.


thank you krasi very helpful. i guess instead of a gap down open it looks we will have a gap up open following the dc news, but i think it will fail. does october 11+/- fit your next 5-10 week low (not sure it is a 20 week low..) ?
ReplyDeleteJP
or october 5 +/- ? these are my two potential lows
DeleteJP
I expect one more 20d cycle usually 9-11 trading days minus 3 already means 6-8 days or 9th-11th of October.
Deletethank you! it's going to be an interesting week
DeleteJP
as long as the 10yr yield hasn't tested the 5-5.2% level the sp will keep on going down. first sustainable bounce in sp will come when these yield levels are reached. we'll see.
DeleteJP
I think we saw the 20w low last week
ReplyDeletewe "should" have a little retracement/bounce but the decline is not done
ReplyDeleteJP
krasi what if the little blip on sept 19 was the 5 week low and we are only putting in maybe tomorrow an 11/12 td low only which gets us to end of next week for the 10 week low. i know it sounds extremely bearish but the count holds. any thoughts are welcome. thank you
ReplyDeleteJP
one more thing to add to my bearish stance is that we closed today below the october/march trendline on sp, same as ndx did last week on its december/march trendline.
DeleteJP
TLT was definitely not a good place to "hide out"
ReplyDeleteTlt and gold going hand in hand over the cliff
DeleteI will have to say, though, that on the MONTHLY chart, TLT has set-up beautifully for a bullish divergence of price vs. all indicators/parameters for a long-term reaction upward or larger. We'll see.
DeleteFXY fits the same monthly scenario above as well, and of course, the US$ (UUP) the exact opposite.
DeleteS&P go inside the chanel, one day is not enough
ReplyDeletethe spx 200 ma was tested overnight by es but not during regular hours before bouncing hard. assuming this was the 11/12 td cycle low this bounce should complete by friday' s nfp positive reaction or latest by monday. next week we should head back south and comfortably break the 200ma by mid-october. if the bounce lasts beyond monday then something else is going on but i don't think it will.
ReplyDeleteJP
Krasi, you had posted this TLT chart a few weeks back. https://imgbb.com/YkbPYwZ
ReplyDeleteInstead of marching towards the 4y high, it looks like TLT is at a 4y low. What's the anomaly?
everyone thinks that when bonds start rallying (yields declining) then equities will do the same thing and begin to rally. they may do it initially for a very short term as we witness it now but ultimately the positive correlation between bonds and equities will invert as money will start flowing into bonds out of equities. that's when the real equities' massacre will begin.
ReplyDeleteJP
If we have wave 1, 2, 3, 4 then we have to see wave 5 to ATH
ReplyDeletedelusional fantasy
DeleteJP
The move down looks like an ABC
ReplyDeletewe should have a short term low on monday but more decline after a couple of days bounce.
ReplyDeleteJP
C of an A Wave today? Gap down Monday looks likely
ReplyDelete