Trading trigger - another cross and buy signal.
Analysis - long term sell the rips, we have major top. Intermediate term low and higher for a while.
P.S. - for a trade both analysis and trigger should point in the same direction.

TECHNICAL PICTURE and ELLIOTT WAVES
Short term - another zig-zag higher. Most likely part of a bigger double zig-zag.
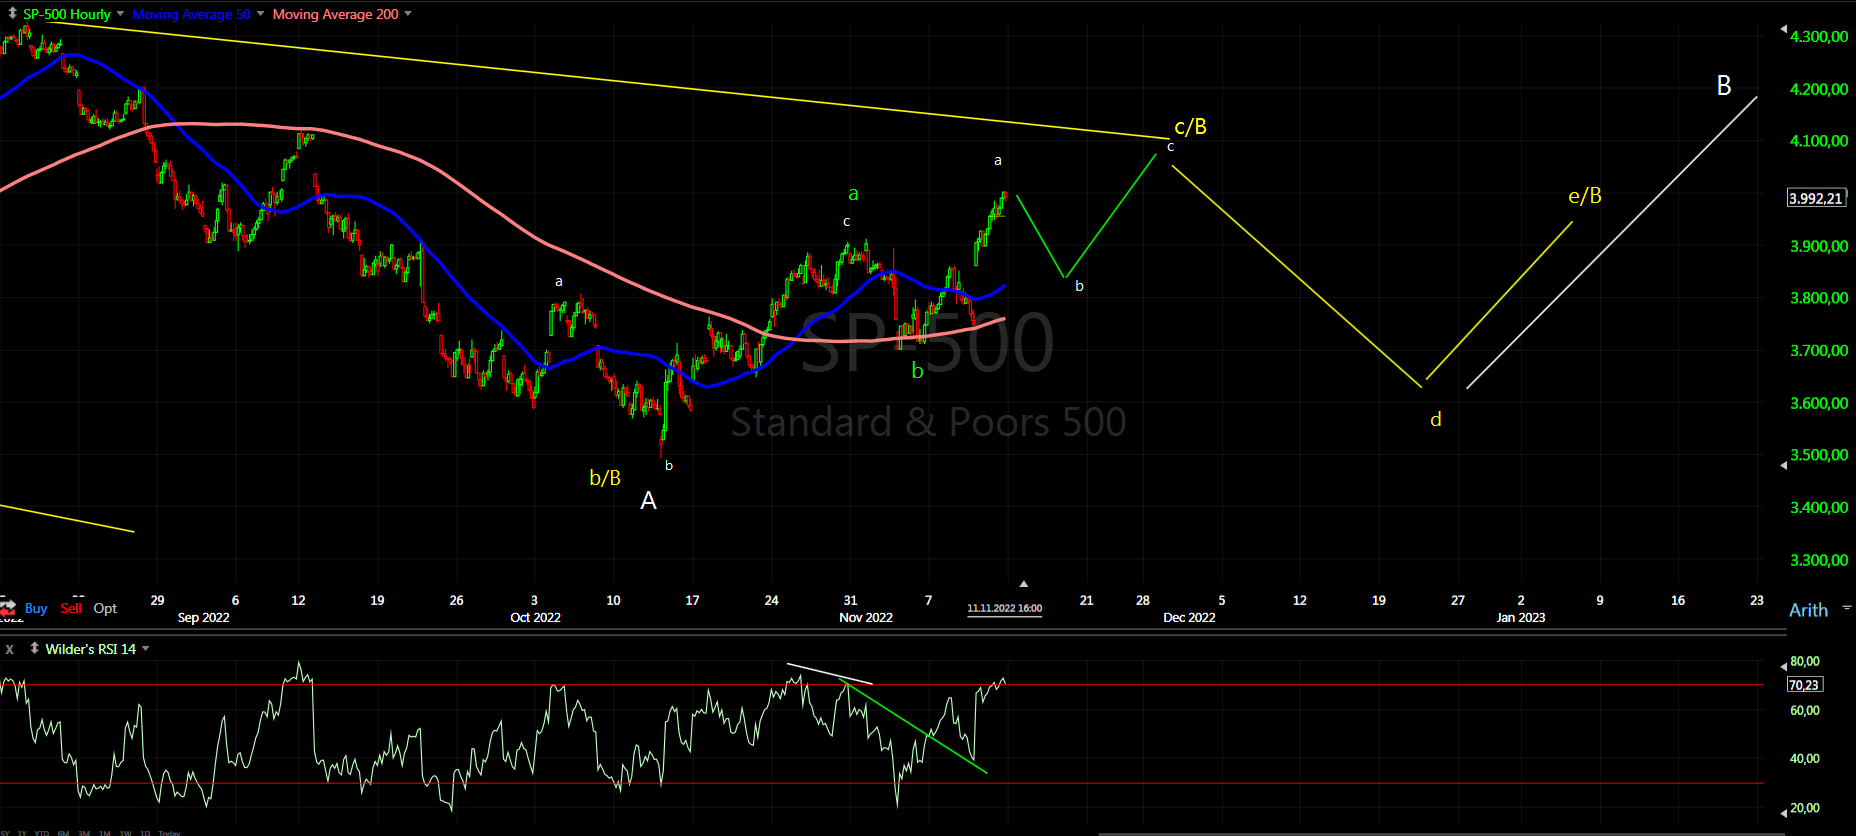
Intermediate term - we have an intermediate tern low, the pattern is not clear at the moment. I am watching this two options.

Long term - most likely huge double zig-zag from the 2009 low B-wave was completed and multi year decline has started. If we are lucky it is lower degree b-wave with c-wave to follow.

MARKET BREADTH INDICATORS
Market Breadth Indicators - showing strength so we have intermediate term low, but the price action is weak. It feels like indicators reset not a reversal.
McClellan Oscillator - strong, but now with divergence.
McClellan Summation Index - buy signal.
Weekly Stochastic of the Summation Index - buy signal.
Bullish Percentage - strong overbought level.
Percent of Stocks above MA50 - strong overbought level.
Fear Indicator VIX - declining.
Advance-Decline Issues - positive, but declining.
HURST CYCLES
Short term cycles - 20d high and next week we should see 20d low. The cycle highs look clear the lows not so much. This is the current... guess - most likely we will not see clear 10w low as with the previous 20w cycle.

Week 13 for the 20w cycle high. RSI confirmed 20w low and now moving higher into 20w high. Most likely 18m low in October. Worst case scenario is counting 18m cycle from October.2021 than the 18m low should be in January.


Krasi, the RSI is very positive even in the weekly chart
ReplyDeleteExplain what is so positive?
DeleteSimilar rsi set up in 2008, there was a bounce and sideways for a few weeks and then a hard drop. This may take longer.
DeleteThe weekly divergens
ReplyDeleteIt is not a divergence, it is a b-wave with lower low.
DeleteWhat if we have a surprise?
ReplyDeleteNasdaq from December 2018 to now 4 years with three 18m cycles.
Is it possible 4 year low now?
No, 2018 is not 4year cycle low. NDX is stronger with running correction and not different pattern.
DeleteXle daily looks like a B wave with a C to follow. Are you thinking a large drop in the energy sector first?
ReplyDeleteDouble zig-zag from 2020 completing after that lower into October 2023 and 4 year low.
DeleteWould gold and other PMs also follow suit, Krasi?
DeleteYes, PM should complete 9 year cycle low.
DeleteDo you think XLE has completed double zig zag and topped?
DeleteThe reason I ask, GDX has broken out of a beautiful classic H&S bottom pattern (daily) with perfect volume confirmation(s) on LS, head, and RS/breakout. May just be a short-term to intermediate-term reaction, to set up divergences on weekly/monthly charts?
ReplyDeleteWe should see one more low next year to complete the pattern from the high in 2020.
DeleteThanks much for your thoughts/input,.
DeleteIf August was 40w high, where would you put the next 5w high?
ReplyDeleteIt is shown on the short term cycle chart above.
Delete20d high last Tuesday?
ReplyDeleteFriday looks much better
DeleteI think Monday.
DeleteHi Krasi, looking forward to your post. Do you think the next bigger leg down starts soon?
ReplyDeleteNot now, maybe in a few weeks.
Delete