Trading trigger - buy signal.
Analysis - long term topping process for important high 4y cycle high. Intermediate term higher into 40w cycle high.
P.S. - for a trade both analysis and trigger should point in the same direction.

TECHNICAL PICTURE and ELLIOTT WAVES
Short term - again no impulse just another double zig-zag reached Fibo measurements.

Intermediate term - it looks like complex pattern for the Y-wave. Now we have more clarity - the most common pattern for years is double zig-zag and we have it completed at different degrees(black y/Y). Another variant of this pattern is shown below. Alternate this could be simple zig-zag a-b-c with c-wave ending diagonal to complete around the elections. Low probability simple Y-wave with a top in July and now in the b-wave of a flat(grey y/Y) - this b-wave is very common pattern in the tech sector, look at MSFT/NDX/SOX for example.

Long term - double zig-zag(from 2020) for y/B at 9y cycle high 2000-2007-2015-2024.

MARKET BREADTH INDICATORS
Market Breadth Indicators - mixed signals...
McClellan Oscillator - around zero.
McClellan Summation Index - buy signal.
Weekly Stochastic of the Summation Index - buy signal with divergence.
Bullish Percentage - pointig higher with long term divergence.
Percent of Stocks above MA50 - pointig higher with long term divergence.
Advance-Decline Issues - turned lower with divergence.
Fear Indicator VIX - higher low and multiple divergences.
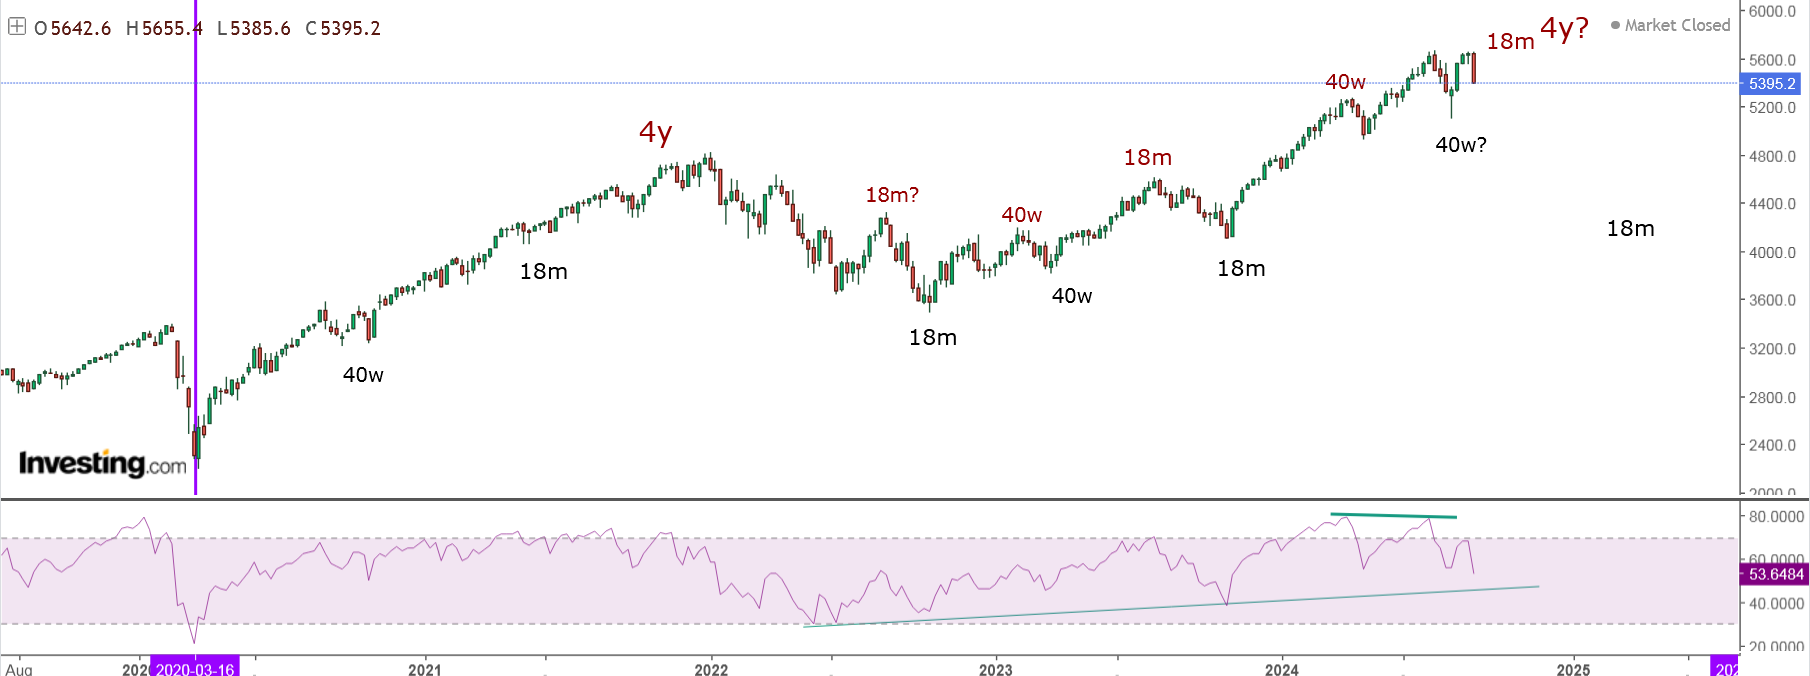
HURST CYCLES
Short term cycles - this should be 20d high. The longer cycles are not clear... too long for 10w cycle too short for 20w cycle. Maybe 20w high to complete 40w cycle high. Speculation is shown how we can have 10w low and 20w high with average length.

Higher into 40w high the fifth one for the current 4y cycle high.... We have several shorter 40w cycles 25 weeks long, the current one is now 26 weeks long - could this be the top with another shorter cycle?