Jun 29, 2025

Weekly preview

The leg up from the April low is completing - next is decline into 20w low.
Pattern looks close to be completed impulse or double zig-zag, market breadth turned lower, cycles close to 40w high, even if you count from the latest top in mid-February there is 4 months or 20w high - so next is decline into 20w low.

Long term - if this is 40w high we should see long b-wave until October for 40w low to digest the sharp rise and one more leg up to complete the pattern all the way back to 2009. Alternate it develops faster and it takes less time one 20w cycle high instead of 40w cycle for major top. The bearish scenario (I do not give it high probability) - we have impulse from the April low and this is either the fifth wave to complete impulse from the 2022 bottom or c-wave to complete Y-wave as a flat.


TECHNICAL PICTURE and ELLIOTT WAVES
Short term - a mess for more than a month. The usual double zig-zag or impulse with very long sideways 4th wave?
Judging by the last few years it should be zig-zag.


Intermediate term - next should be b-wave. In red the alternate bearish scenarios wave 5 or flat c/Y.


Long term - wedge(from 2020) for c/B at 9y cycle high 2000-2007-2015-2025.


MARKET BREADTH INDICATORS
Market Breadth Indicators - topping with divergences.
McClellan Oscillator - around zero.
McClellan Summation Index - sell signal.
Weekly Stochastic of the Summation Index - sell signal.
Bullish Percentage - turned lower with divergence.
Percent of Stocks above MA50 - topping with divergence.
Advance-Decline Issues - in the middle of the range with divergence.
Fear Indicator VIX - bottoming with divergence.


HURST CYCLES
Short term cycles - next week we should see 20d high and very likely 20w high.


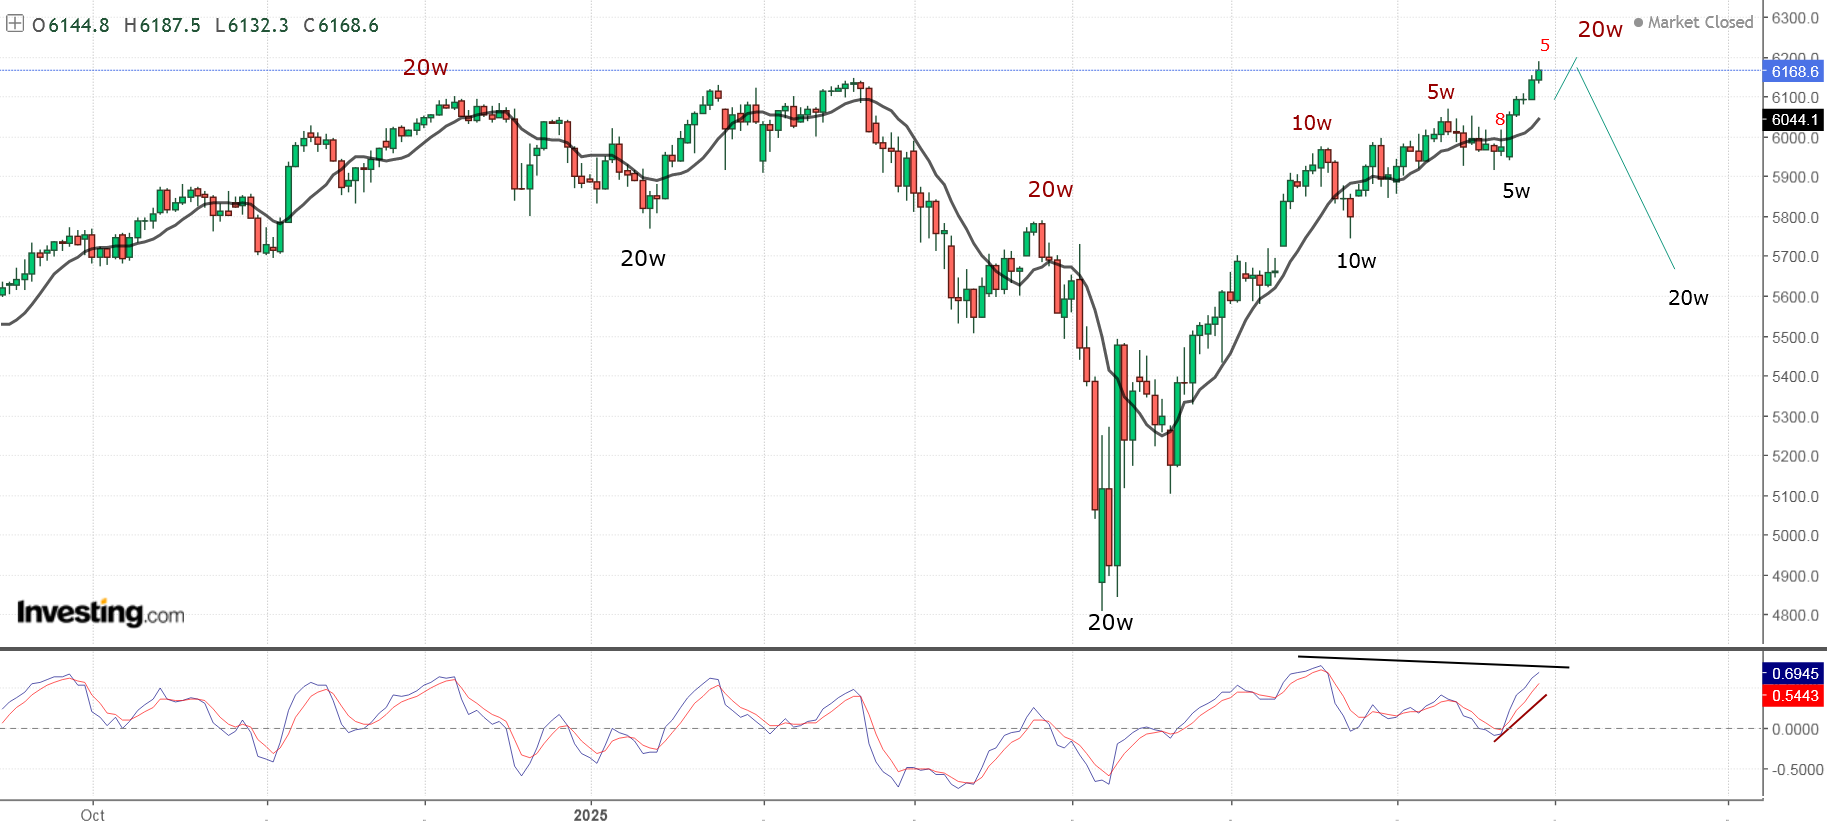
Long term cycles - possible 40w high next week.

Jun 23, 2025

Quick update

Nothing new, just more of the same mess since mid-May.

Watching a-b-c or impulse from the April low... impulse will complete just on time for 40w high.

Jun 16, 2025

Weekly preview

The price action looks like weak fifth wave ED to complete impulse from the April low.... probably a-wave of a bigger pattern. In this case we should see b-wave lower into July for 20w cycle low.
Big picture alternate scenarios with impulse are bearish - this is c/Y-wave and we have Y wave as a flat correction or the fifth wave of an impulse completing from the 10.2022 low.


TECHNICAL PICTURE and ELLIOTT WAVES
Short term - it looks like completed pattern from the April low.


Intermediate term - bigger b-wave not just pullback into July for 20w cycle low. In red the alternate bearish scenarios.


Long term - zig-zag(from 2020) for y/B at 9y cycle high 2000-2007-2015-2024.


MARKET BREADTH INDICATORS
Market Breadth Indicators - with divergences, expect move lower.
McClellan Oscillator - below zero.
McClellan Summation Index - buy signal with divergence.
Weekly Stochastic of the Summation Index - sell signal.
Bullish Percentage - divergence.
Percent of Stocks above MA50 - divergence.
Advance-Decline Issues - divergence.
Fear Indicator VIX - long term multiple divergences.


HURST CYCLES
Short term cycles - 5w high this week and now lower into 20w low.


Long term cycles - 40w low right on schedule and now higher into 40w high.

Jun 9, 2025

Quick update

Waiting to see if this is b wave.... it starts looking like fifth ED.

Jun 1, 2025

Weekly preview

Nothing new to add, pullback running probably 20d high early next week and decline to complete 10w low.


TECHNICAL PICTURE and ELLIOTT WAVES
Short term - pullback running, using trend lines and support it should look like this


Intermediate term - pullback is running, when it is over we should see continuation higher into July.


Long term - Long term - zig-zag(from 2020) for y/B at 9y cycle high 2000-2007-2015-2024.


MARKET BREADTH INDICATORS
Market Breadth Indicators - pointing lower.
McClellan Oscillator - around zero.
McClellan Summation Index - sell signal.
Weekly Stochastic of the Summation Index - sell signal.
Bullish Percentage - around overbought level.
Percent of Stocks above MA50 - around overbought level.
Advance-Decline Issues - in the middle of the range.
Fear Indicator VIX - at support trend line.


HURST CYCLES
Short term cycles - close to 20d high and next lower into 10w low.


Long term cycles - 40w low right on schedule and now higher into 40w high.