Trading trigger - buy signal.
Analysis - close to 18m high then lower into 18m low
P.S. - for a trade both analysis and trigger should point in the same direction.

TECHNICAL PICTURE and ELLIOTT WAVES
Short term - the low this week could be w4 low. In this case after extended third wave most common target is 5=1 around 5360.

Intermediate term - if we see completed impulse than this is the top if not it is just b-wave. The equally weighted index still has not made higher high so it depends on the pattern.

Long term - 4y cycle high the end of 2021, now a-b-c lower into 4y cycle low. Alternate this is the top of wave-B from 2009.

MARKET BREADTH INDICATORS
Market Breadth Indicators - turned lower with double divergences.
McClellan Oscillator - below zero.
McClellan Summation Index - double divergence.
Weekly Stochastic of the Summation Index - buy signal.
Bullish Percentage - turned lower at 70 with double divergence.
Percent of Stocks above MA50 - in the middle of the range, with double divergence.
Advance-Decline Issues - in the middle of the range.
Fear Indicator VIX - double bottom.
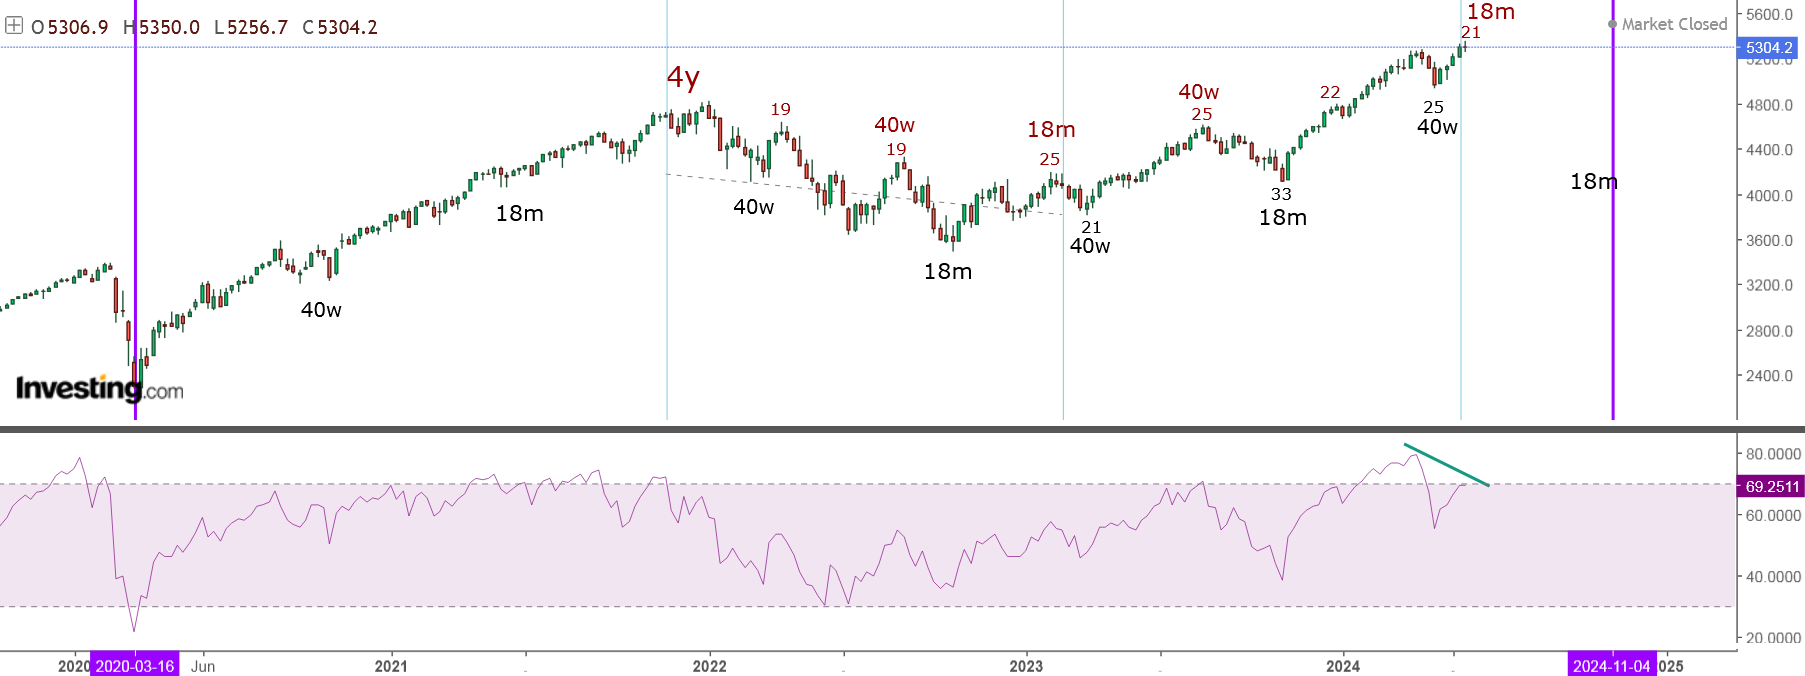
HURST CYCLES
Short term cycles - the count from last week seems to work so 5w low and next week 10w high.

It does not look like the cycles are back to average length. This is 18m high and if you look back from the 4y high the two 18m cycles divide better in three 20-25 weeks long cycles not in two.
The lows - it looks like we have two shorter 40w cycles and one with average length. It is week 30 and the 40w cycle should be making a low instead we have a high so more likely we have another short 40w cycle. This will be confirmed if we see the next low in July or later.
Overall this is 18m high next is decline into 18m low most likely around the elections in the USA in November... less likely to extend into January-March.2025
Someone asked about bitcoin... I have looked at it closely and it seems bitcoin has pretty regular cycles and high correlation with the indices.
Intermediate term next important high September/October, next 40w low January/February 2025.
Long term 4y high the second half of 2025 at the same time we should see 4y high for the indices too.
Not a very long history, but the 4y cycle highs(red) and lows(black) seem to occur regularly so far.

The 40w cycle lows and highs(from the last 4y high and low) running 8-9 months.


