Trading trigger - no signal, flat EKG:)
Analysis - long term sell the rips, we have major top. Intermediate term high - impotant high in a few weeks expected.
P.S. - for a trade both analysis and trigger should point in the same direction.

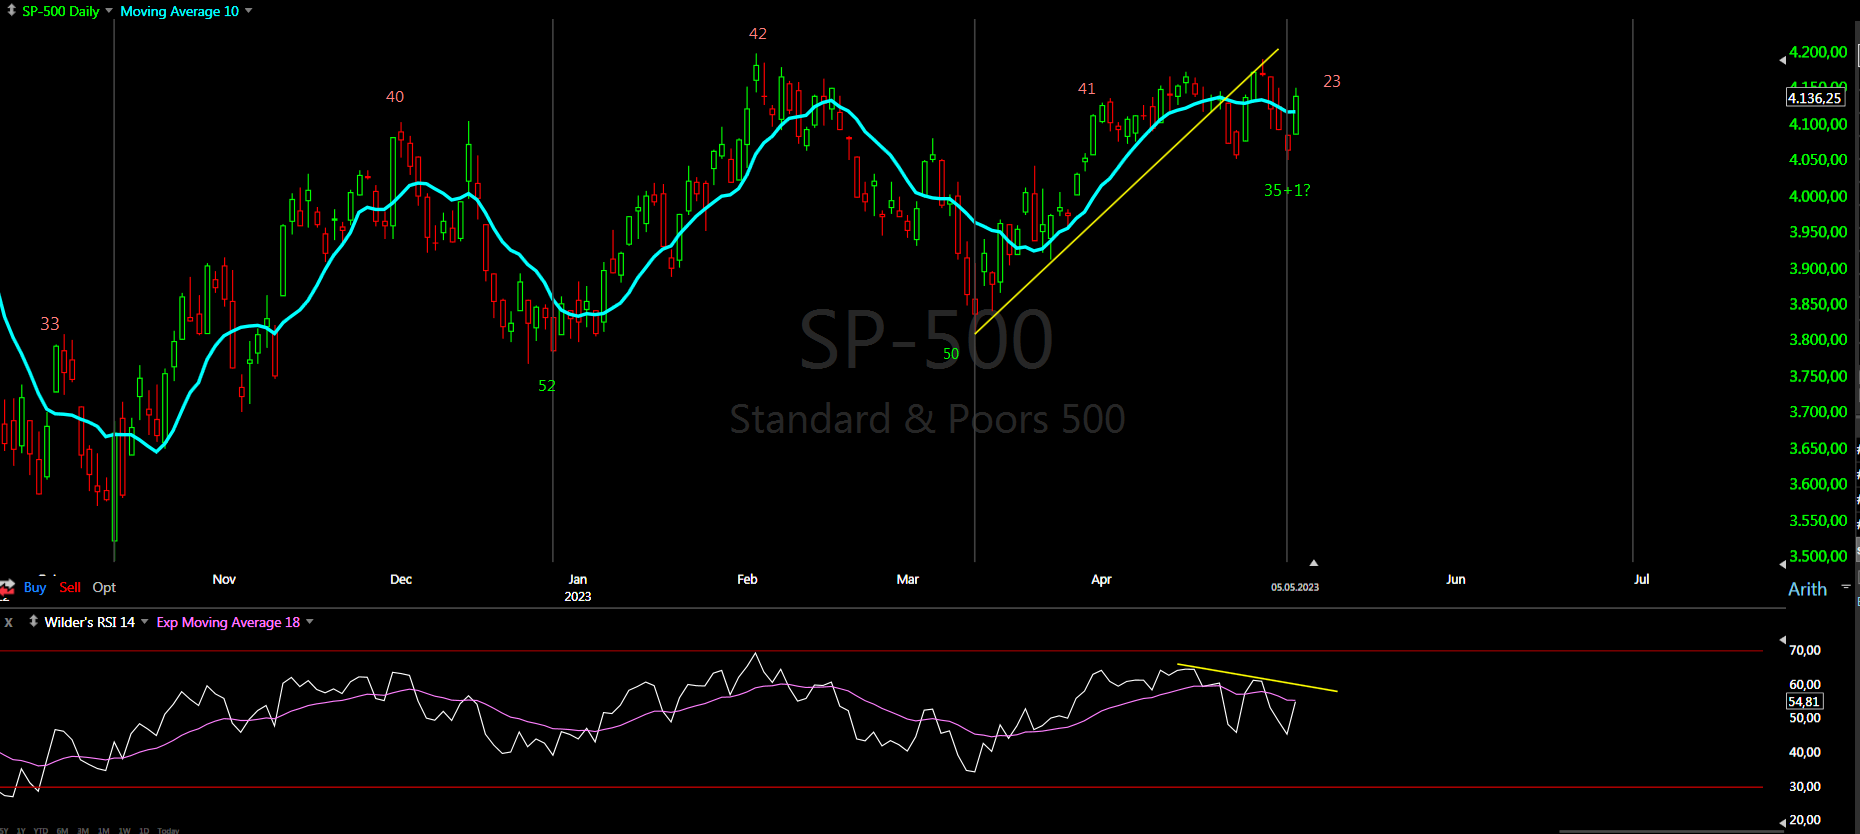
TECHNICAL PICTURE and ELLIOTT WAVES
Short term - I see zig-zag and triangle - lets see if it will play out... it is difficult to navigate such mess.

Intermediate term - It is a complex pattern I think it started in June.2022 some w-x-y, alternate w-x-y from the October low.

Long term - most likely huge double zig-zag from the 2009 low B-wave was completed and multi year decline has started. If we are lucky it is lower degree b-wave.

MARKET BREADTH INDICATORS
Market Breadth Indicators - the same... pointing lower, in the middle of the range.
McClellan Oscillator - below the zero line.
McClellan Summation Index - sell signal.
Weekly Stochastic of the Summation Index - sell signal.
Bullish Percentage - pointing lower, in the middle of the range.
Percent of Stocks above MA50 - pointing lower, in the middle of the range.
Fear Indicator VIX - up and down, complacency lower than the ATH.
Advance-Decline Issues - pointing lower, in the middle of the range.
HURST CYCLES
Short term cycles - close to 20d high... final push lower for 10w low or we saw it already?

Week 9 for the 20w cycle. Close to important high and next should be the last 40w cycle of the 4y cycle.