Trading trigger - buy signal.
Analysis - at the top. Important turn lower - waiting for confirmation next week.
P.S. - for a trade both analysis and trigger should point in the same direction.

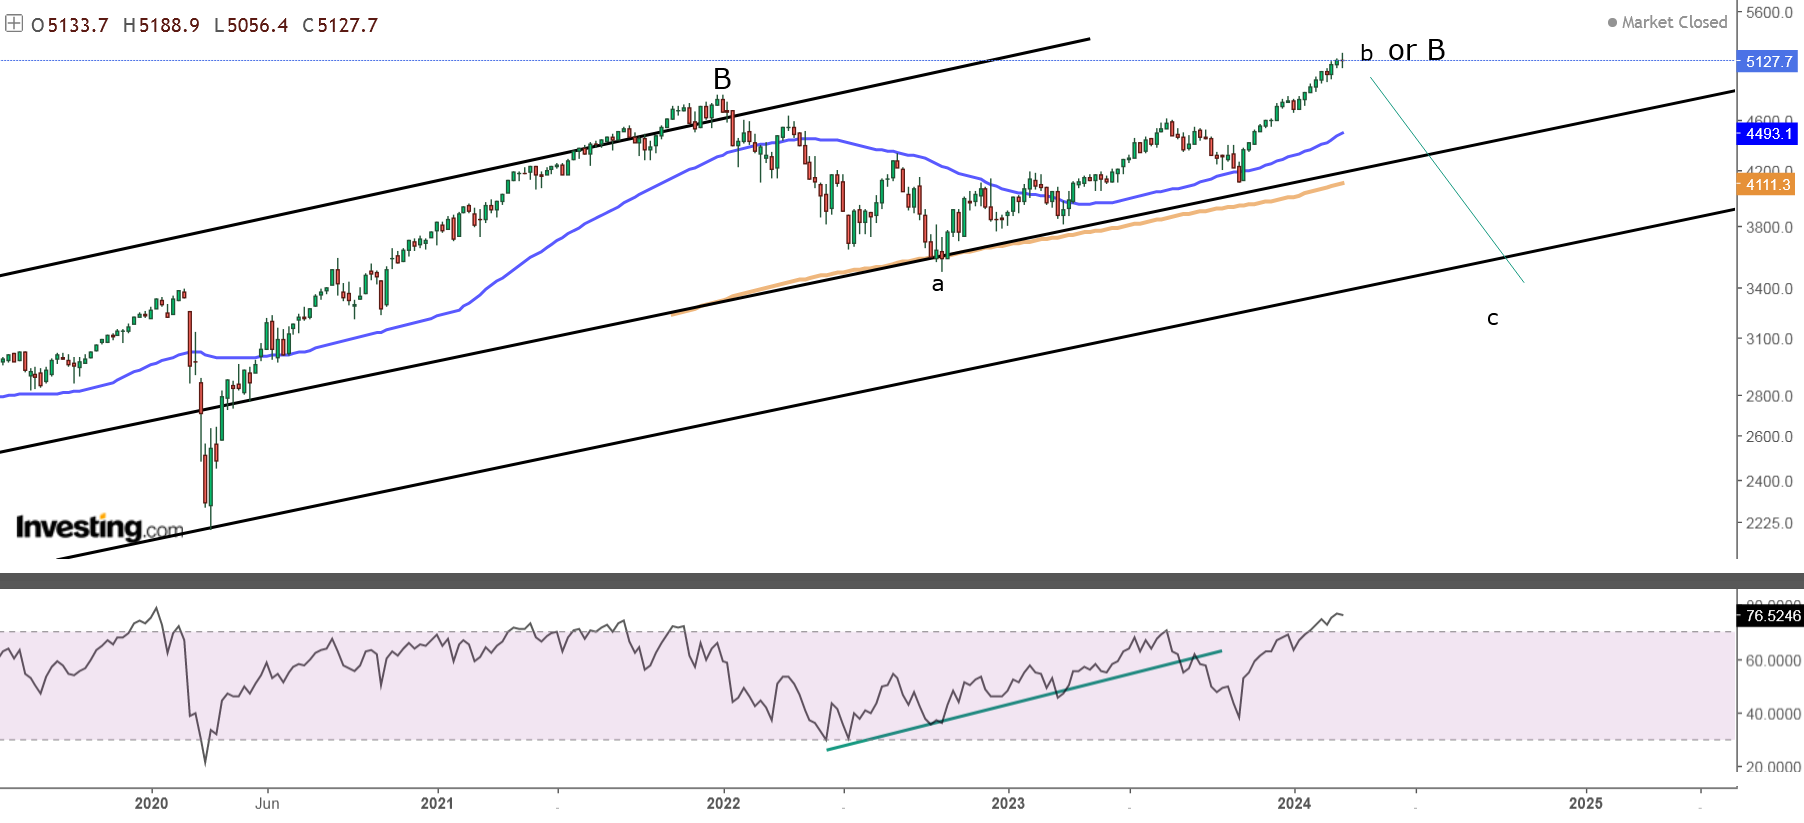
TECHNICAL PICTURE and ELLIOTT WAVES
Short term - looks like corrective w-x-y with plenty of zig-zags... difficult to see impulse.

Intermediate term - two double zig-zags for w-x-y at two Fibo targets. This should be the top of corrective B-wave and C-wave for a flat should follow. Alternate this is a-b-c from the 2020 low and the top from 2009.

Long term - 4y cycle high the end of 2021, now a-b-c lower, alternate this is the top from 2009.
MARKET BREADTH INDICATORS
Market Breadth Indicators - weak with divergences.
McClellan Oscillator - above zero, multiple divergences.
McClellan Summation Index - very weak buy signal.
Weekly Stochastic of the Summation Index - buy signal.
Bullish Percentage - divergence.
Percent of Stocks above MA50 - divergence.
Advance-Decline Issues - multiple divergences.
Fear Indicator VIX - multiple divergences.
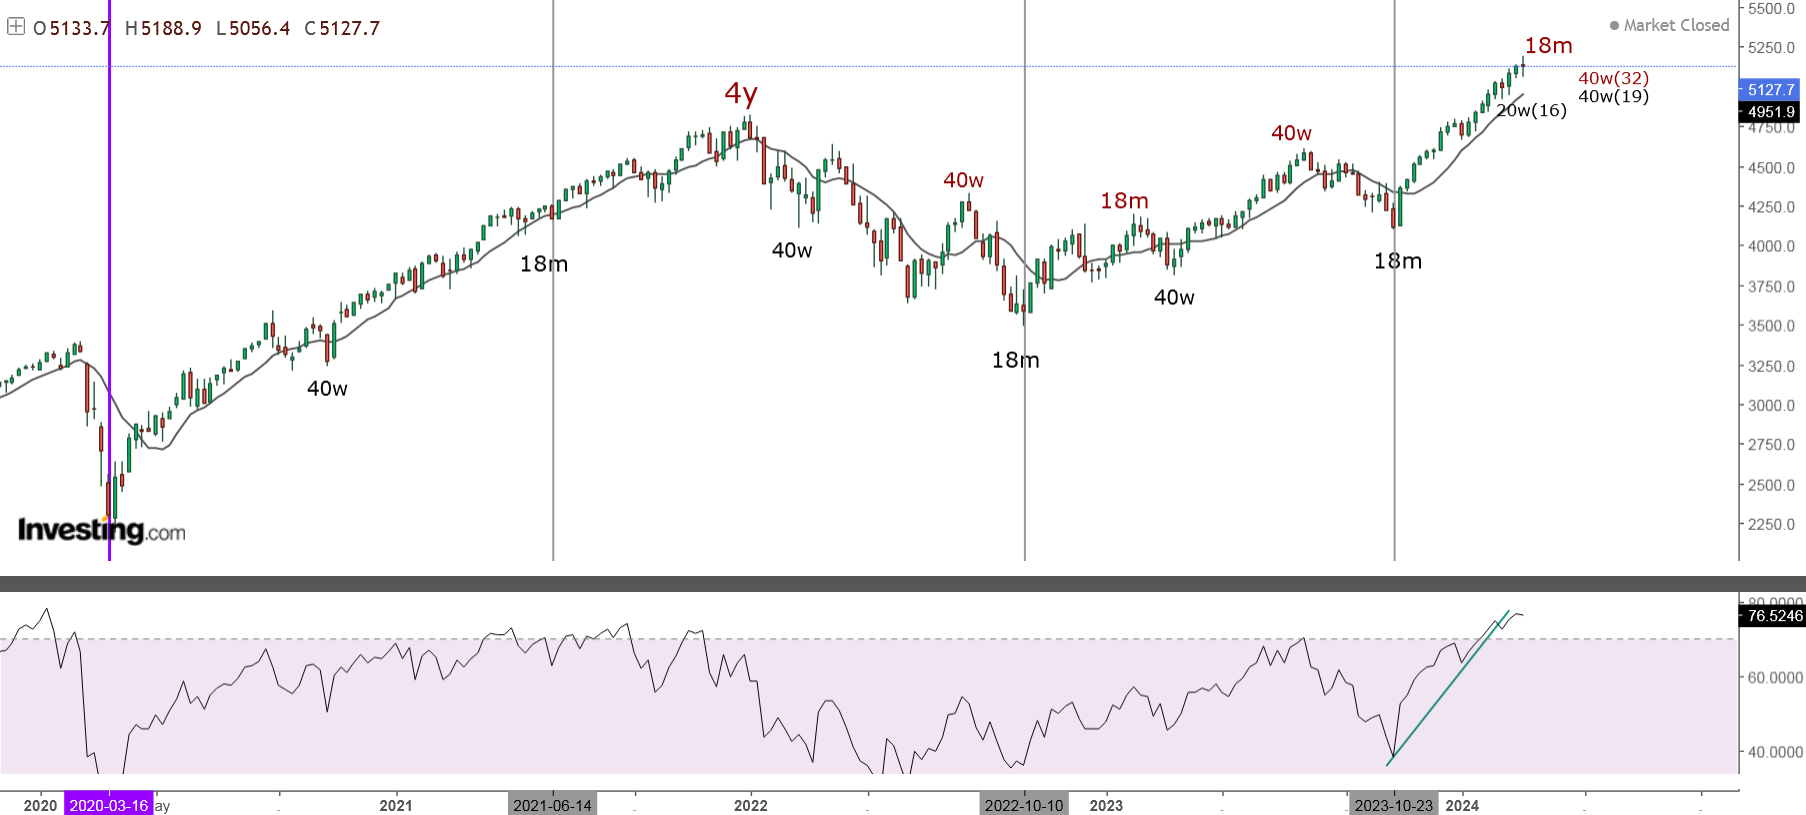
HURST CYCLES
Short term cycles - choppy moves makes it difficult to count shorter cycles. The highs look like three extended 10w cycles, 5w cycle high in the middle and three 20d cycles to complete 5w/10w/40w cycle high.
The lows - sticking to the theory 20w low in February, but vusualy probably three extended 10w cycles too.

Week 19 for the 40w cycle. Probably 40w cycle consisting of three extended 10w cycles, but if I have to pinpoint 20w low it should be at week 16.
Week 32 high-to-high, at the top of at least 40w cycle... and very likely 18m cycle high too.
Average length for the 40w cycle is 32-36 weeks the last 40w low was 33 weeks long and now the high is 32 weeks long maybe the market is back to normal rhythm after shorter cycles from mid-2022 to mid-2023.