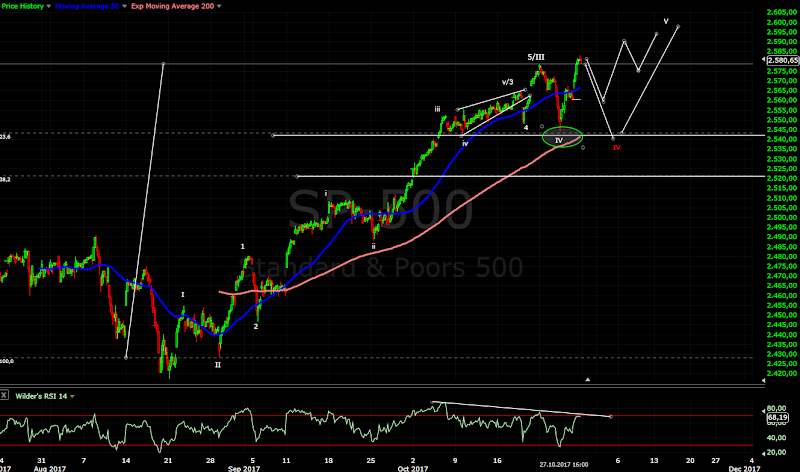
Short term view - higher for the final wave 5 from the August low.
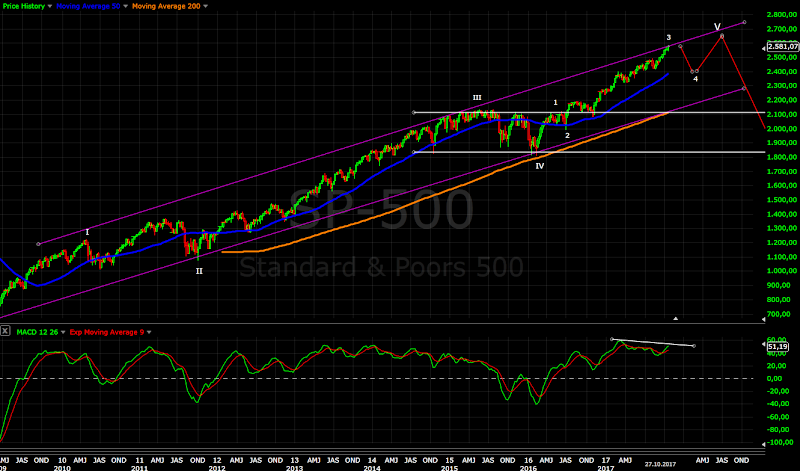
Intermediate term view - heading higher for the top of wave 3 from the Feb.2016 low.
SP500 squeezed a few points and we saw pullback 30 points. Every index looks a little bit different short term, but the common is one more high or to finish the final wave so I still expect one more high before an important top.
TECHNICAL PICTURE and ELLIOTT WAVES
Short term - the first target for a pullback was hit(the green circle from last week). The move lower has only three legs which is corrective. On the upside despite the strength the move so far is only a-b-c too(better visible on the NYSE and DJ probably not so much tech stocks in the index). In this case there is two options - one more leg lower for a flat correction(the red IV) or a ED for wave V.
Of course there si a bullish option acceleration higher for an impulse, but looking at the indicators and other indexes it does not look likely.
Intermediate term - now waiting for one more higher high for nice finished pattern with RSI/MACD divergence. This should be the top of wave 3 from the Feb.2016 low.
Long term - no change, waiting for the top of the current leg higher then one more correction and a rally before the end of the bull market.
MARKET BREADTH INDICATORS
Market Breadth Indicators - all indicators turned lower. I expect to see divergences when the final wave up is running.
McClellan Oscillator - below zero, one final move above zero for a divergence will look great.
McClellan Summation Index - sell signal, expecting a divergence after the final wave up.
Weekly Stochastic of the Summation Index - sell signal.
Bullish Percentage - sell signal.
Percent of Stocks above MA50 - turned lower and below 75.
Fear Indicator VIX - I expect higher low and explosion higher.
Advance-Decline Issues - lower since September and now plunging below 0.... strange for "strong" indexes making all time highs.
HURST CYCLES
The low for the 40 day cycle was hit at day 47, alternate one more leg lower for 2-3 days.
Week 10 of the 20 week cycle.
Tom Demark SEQUENTIAL AND COUNTDOWN - this technique spots areas of exhaustion.
Now we have finished sell setup on the weekly chart. For a sell signal we need a price flip.
Oct 28, 2017
Oct 21, 2017
Weekly preview
Short term view - higher for a day or two to finish wave 3 from the August low.
Intermediate term view - heading higher for the top of wave 3 from the Feb.2016 low.
The ED broke lower, but only for a day which means it was a move from a minor degree and my short term pattern was wrong. The big picture has not changed much - the indexes are heading higher for the top of waves 3 from the Aug.2007 and Feb.2016 lows. TECHNICAL PICTURE and ELLIOTT WAVES
Short term - a lot of room for speculation... on the chart is the count which I was following so far with the internal waves adjusted. Alternate we could see two more highs not only one( the green label). When we see the next low we will know more. For more bullish count it should stay above 2540-2545(the green circle) for the current count it should drop deeper to around 2525.
According to the theory the maximum extension for wave 3 is 4,236 and this is around 2588.
Intermediate term - I was asked about timing the next important lows are 40 week cycle low in the next 6-10 weeks and 18 month cycle low in Q2 May/June(if wee see average cycle length). Adjusted the chart for time... sudden deep sell off does fit much, retracing time looks more likely. In 1993/1994 and 2006/2007 when the VIX stayed below 10 for while the outcome was short living plunge 7%-8%. So finishing the wave higher and similar correction to support/MA200 for 40 week cycle low looks better, after that the indexes should burn time - either this is the top of iii of 3 and they burn time with waves iv/v of 3 and 4, or wave 4 will be time consuming some complex double zig-zag or triangle.
Long term - no change, waiting for the top of the current leg higher then one more correction and a rally before the end of the bull market.
For those who think that the indexes will continue higher should look at the weekly chart and RSI. It is more likely the indexes to hit the trend line and correct than to continue higher.... so far since 2009 we have not seen exception.
MARKET BREADTH INDICATORS
Market Breadth Indicators - look "surprisingly" weak given the new ATH which we see.... some are trying to turn lower, but it is too early to talk about confirmed sell signal. We are seeing peek complacency I think from now on VIX will make only higher lows.
McClellan Oscillator - below zero.
McClellan Summation Index - sell signal, but just crossed the signal line.
Weekly Stochastic of the Summation Index - just turned lower, but close to overbought levels too early gain.
Bullish Percentage - buy signal.
Percent of Stocks above MA50 - a few points above the 75 level.
Fear Indicator VIX - short term divergences with very very tight BB.
Advance-Decline Issues - in the middle of the range.
HURST CYCLES
Day 44... I do not know if this intraday low should be counted as a cycle low or not. RUT for example makes very nice wave 4 and cycle low at day 44. I think it is more likely to see a longer cycle and we have not seen the low yet for the current 40 day cycle.
Week 9 of the 20 week cycle.
Tom Demark SEQUENTIAL AND COUNTDOWN - this technique spots areas of exhaustion.
We have now finished combo and countdown on the daily chart and week 8 of a sell setup on the weekly chart.
Subscribe to:
Posts (Atom)


