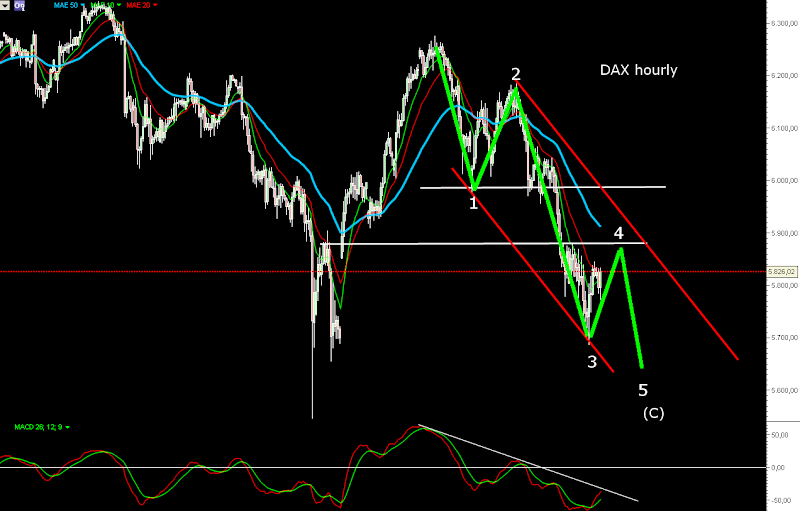
As I have expected a sell of and thats what happened. The indexes finished the week on the red - DJ -426 points(-4%) and DAX -227 points(-3,76%).
I was surprised from the speed... again:)) I was expecting the Dow to hit support the February lows but no so fast:)
So whats next?
The long-term charts are not changed Weekly oscillators and MACD are pointing down, Market breadth indicators - Bullish percentage and NYSE McClellan Summation index are bearish and pointing down.
So I will show the short-term and intermediate-term charts - hourly and daily.
Short-term - Dow has hit support but looking at the hourly charts the wave structure does not look completed so I expect short move up wave 4 followed by another move down the last 5-th wave.(This is DAX but Dow looks the same way)

Intermediate-term - I think we will find support around the February lows ~9800-9900.
Look at the NYSE McClellan Oscillator and S&P500 Percent of Stocks above 50 day moving average - they are at extremes and tell us to expect move in the opposite direction. So next week or two I expect to build some base followed by a rally. But i do not expect this rally to make new highs rather a right shoulders ~10750 of a large H&S topping pattern.


I have shown the move with higher probability for me, but we have only one bullish candle from Friday no single other bullish signal so the indexes could just go lower and stay oversold for some time. Than we will see something like the charts bellow.


No comments:
Post a Comment