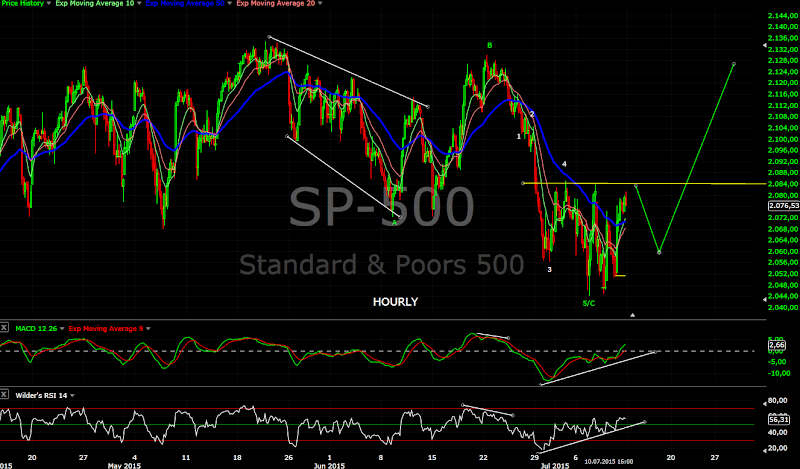
Short term view - I think the week will begin with a move lower and than the price will reverse higher.
Intermediate term view - I expect final move higher before a significant correction.
Ok move lower to the 2040 support area as expected and since than the price is playing ping pong between support 2040 and resistance 2085. The low was on Tuesday as I wrote the update, but since than we have such erratic moves... I doubt someone can predict them. Nevertheless when I look at the other markets like DJT/Europe I think we have an intermediate term bottom. I will be very very surprised to see a move bellow 2040.... something unexpected should happen.
Short term - as long as the prices are moving between 2040-2085 we have no confirmation in which direction the price will move. I think it will be higher but first we will see a move lower making higher low, which should be a good buying opportunity. The low for the correction since May should be behind us and you have a clear stop level which is not so wide.
Intermediate term - if I am right about cycles and EW the prices should move higher for the rest of the summer and in September we will watch for signs of a top.
In Europe the indexes finished a zig-zag and we have impulse higher exactly as predicted despite fear about Greece - exactly what you want to see at the end of a correction fear. Market breadth smells more and more like a bottom - we have fear and divergences. Cycles - 40 weeks cycle low(or even 18 month). EW 100% corrective structures both US and European indexes, which means May was not a major top.
The only bearish thing I can see is that this is the first leg of a bigger corrective structure and will see lower highs something like DAX 12000 and SP500 2120.
TECHNICAL PICTURE
Short term - It looks like a H&S to me... expecting the right shoulder. This will be a tradable low with narrow stop.
Intermediate term - main scenario wave 5 of the wedge, alternate scenario we saw the first corrective leg of a bigger correction expect lower high around 2120.
Long term - significant correction after the move higher is over. Target - MA200/the support zone/the start of the wedge.
MARKET BREADTH INDICATORS
The Market Breadth Indicators - now we have extremes(fear) and divergences... smells more and more like a bottom to me.
McClellan Oscillator - above zero and diveregence
McClellan Summation Index - sell signal
Weekly Stochastic of the Summation Index - sell signal in oversold territory for weeks. I am expecting the next move higher.
Bullish Percentage - sell signal.
Percent of Stocks above MA50 - reached a level where corrections usually end and divergence.
Fear Indicator VIX - we saw fear and levels where corrections usually end. Expecting to move lower and make higher low for a divergence when we hit important high.
Advance-Decline Issues - touched the oversold level and reversed.
Put/Call ratio - the lowest level in the last three years... fear in the markets:)
NYSE New Highs-New Lows - oversold levels and divergence.
HURST CYCLES
I think the cycle of higher degree lasted longer and have one extra daily cycle.
The 40 weeks cycle lasted longer, but nothing extreme. Expecting to see a confirmation for a cycle low next week.
Tom Demark SEQUENTIAL AND COUNTDOWN - this technique spots areas of exhaustion.
On the daily chart we have price flip and the setup was aborted - another signs that the move is not an impulse. On the weekly chart the setup is still alive and there is high probability that we will see 8 next week.
Subscribe to:
Post Comments (Atom)


Will you be doing an update on golf?:) Regards.
ReplyDeleteOops! Gold
ReplyDeleteBene grazie! Bravo.
ReplyDeleteIt is very difficult to say at the moment if we saw the low last week or one final push will follow.
DeleteWe are in the timing band for a low and from technical analysis and EW perspective it is possible that the zig-zag lower is finished. That definitely will confirm my forecast shorter cycles,higher low and most traders caught of guard.
It smells like low, but we have only 2-3 green days, there is no confirmation - impulse and higher low.
There is no problem to see for example another lower low and expanded flat. Which will be even better for trading.
The right think to do at the moment is to start scaling back on shorts and watching closely for a long entry after confirmation.
The moves lower are corrective so forget about price crashing.
Here some market breadth indicators to watch - the divergences are visible since November 2014... it is not time for shorts
Deletehttp://stockcharts.com/h-sc/ui?s=%24BPGDM&p=D&yr=3&mn=0&dy=0&id=p01802096960
http://stockcharts.com/h-sc/ui?s=$GDXADP&p=D&yr=2&mn=0&dy=0&id=p86686806630
http://stockcharts.com/h-sc/ui?s=%24GDXUDP&p=D&yr=2&mn=0&dy=0&id=p68288433327
http://stockcharts.com/h-sc/ui?s=%24GDXHLP&p=D&yr=3&mn=0&dy=0&id=p83117061390
Only zig-zags since November and double MACD divergence http://stockcharts.com/h-sc/ui?s=GDX&p=D&yr=1&mn=6&dy=0&id=p33535962464