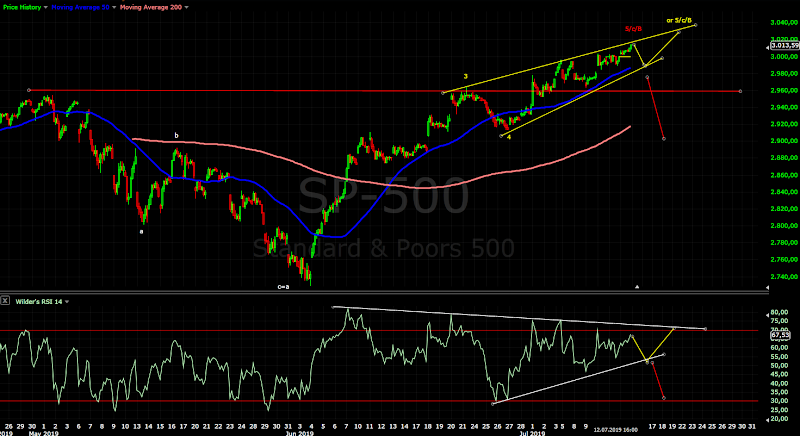
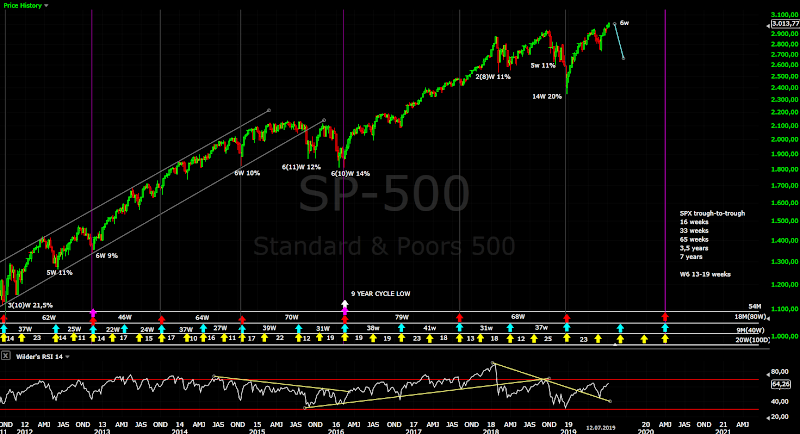
Small down and up moves as expected... time for topping and possible reversal next week. Overall the market is getting more dangerous every day - indicators with divergences on the daily and weekly chart, the daily cycle is nearing a high, market breadth with divergences and now working on short term divergences to signal a high, TomDemark finished countdown on the weekly chart, the pattern starts looking complete, DAX reversal bearish candle formation and divergences on the weekly chart... I do not know how to twist this as bullish.
TECHNICAL PICTURE and ELLIOTT WAVES
Short term - the line in the sand(red bearish) is now around 2950-60. The pattern is tricky I think the fifth wave from June low is running... it could be ED for w5(yellow) one more down/up and the index will hit the trend line on the daily chart around 3025.
Some see zig-zag for b/B expanded flat..... maybe, but I think it has lower probability. At the end for trading it does not matter down is down.
DJI shows better the idea...
Intermediate term - again RSI looks like topping similar to the previous two occasions. They have 4 runs to the 70 level, currently we have three.... one more high w4 and w5 for ED and kissing for good bye the trend line:)
Long term - the indexes are close to the top of wave B or D, when it is finished decline in three waves or impulse is expected.
MARKET BREADTH INDICATORS
Market Breadth Indicators - longer term divergences and some have started to build short term divergences as expected, but still no sell signal - patience.
McClellan Oscillator - another lower high.
McClellan Summation Index - buy signal.
Weekly Stochastic of the Summation Index - buy signal in overbought territory.
Bullish Percentage - turned lower.
Percent of Stocks above MA50 - toping begun?
Fear Indicator VIX - bottoming with long and short term divergences.
Advance-Decline Issues - series of lower highs.
HURST CYCLES
Day 28 for the 40 day cycle - nearing the top of this daily cycle.
Week 6 for the 20 week cycle and 29 for the 40 week cycle.
Tom Demark SEQUENTIAL AND COUNTDOWN - this technique spots areas of exhaustion.
As expected finished countdown on the weekly chart and waiting for a price flip to trigger sell signal.
Subscribe to:
Post Comments (Atom)


Hi Krasi.. when you say down with three wave move or impulse, by impulse you mean a start of 5 wave move? What difference between the two do you have in mind?
ReplyDeleteYes, impulse is 5 waves... the difference is the pattern and how the move lower will play out.
DeleteMany stocks are finishing the third from 2009 so decline in three waves could not be excluded, on the other side flat is more likely than expanded triangle so decline with impulse could not be excluded either. Waiting to see the size of the first wave lower then we will know.
Thank you and one more question about the duration of the coming wave down to complete this correction formation: if the reversal starts in a week or so how long do you think it will last? If we assume that we are dealing with expanded triangle I think about 4 months and if it is a flat about 3 moths. 4 months because each subsequent drop is longer and longer, Jan 2018 lasted 2 months, oct 2018 lasted 3 months so this one should last 4 months. If it is a flat then the drop now should equal the last one with 3 month duration. Would you agree Krasi?
DeleteAt least until Q1 2020 for 4 year cycle low.
DeleteJust the first leg lower will last until August/September for 40 week cycle low.
Krasi I understand the 20, 40 ... week cycle but I do not understand the information that gives us the daily cycle
ReplyDeleteTwo daily cycles and you have 20 week cycle. It fits my trading time frame and it is very easy to follow and trade - just draw the index with MA10. Follow this as simple trading strategy and you will beat the most experts with paid subscriptions:))))
DeleteP.S. the theory is 10/20/40/80 day cycles than the weekly cycles and so on. This are calender days. The cycle I call daily cycle is in fact the Hurst 80 day cycle or 56 trading days and usually is shorter for the US indexes 45 days +-10 days. As I wrote above this is the shortest cycle worth trading for me and I do not bother with other like 20 day cycle.... I just do not care if the index is 2-3 days lower/higher.
Any good resource that does a good job of explaining this in more detail? Thanks Krasi.
DeleteThis guy posts on his blog and has subscription - https://likesmoneycycletrading.wordpress.com/
DeleteThere is no much to explain - above MA10 is up, below it is down and it tracks the daily cycle(or Hurst 80 day cycle) very good.
There is no much details - right translated cycle is strong and the next one will make higher high, left translated cycle is bearish "failed cycle" signals intermediate term decline.
The maximum for w4 of potential ED(yellow first chart) was hit.
ReplyDeleteThe low today must hold if there is one more higher high left.
If we see more to the downside today than the daily cycle turned lower and we should see 2-3 weeks lower.
Hi Krasi. It closed lower today.. do you think it will continue higher or is it time to sell short now?
ReplyDeleteAll the signs point that the daily cycle turned lower. Another higher high has lower probability.
DeleteNow waiting for confirmation - impulse lower... it looks good so far.
Not totally certain , as could still be abc down , where c= 2.618 a.
ReplyDeleteMaybe bounce today and then decision day on the trend friday?
This extension is too much for c wave.... at least according to the theory and I have not seen such c waves. More likely it is an impulse.
DeleteKrasi uvxy target 22?
ReplyDeleteMore likely not. I think the indexes reversed and will make lower high next week.... I doubt VIX will make lower low.
DeleteIt looks like the pullback hit the support and is bouncing again. New highs very likely it seems, Krasi.
ReplyDeleteNot really... at first glance looks like bumpy decline, but it is an impulse.
DeleteBelow DJ chart again with more clear structure.
This is classical impulse for me, RSI looks as it should, the "dance" with the moving averages - w4 resistance at MA50 and the expected retracement resistance at MA200.
One more lower low tomorrow will finish an impulse and the week will close near the low for the week with bearish reversal candle.
I do not see bullish signs... the index should rally above 3000 and close the week there...
https://imgur.com/a/hEzoXfT
I do not see an impulse, overlapped waves
ReplyDeleteThe highs do not overlap with the lows of the waves so there is no overlapping.
DeleteI have seen much uglier reversals than this one.
For SP500 and NYSE there is possible impulse, but for DJ one wave is missing.
Hi Krasi,
ReplyDeleteJust wondering if you still expect one more low Friday? or if that's invalidated with SPX futures overnight high of 3009.50 at time of writing vs ATH of 3223.50? Also appears it went through MA50 and MA200 for Dow futures... Trying to figure out how to trade this. Thanks for your help!
If there is impulse it is finished so no new lows on Friday.
DeleteThere is possible impulse for SP500 and NYSE, but for DJ one wave is missing.
Which means I can not say for sure if this is just retracement or we will see higher high.
It is toping process and the indexes will not turn and crash, so you will not miss much in both directions:)
is this the start of wave 3 of 1 down?
ReplyDeleteIt should be 3 of 1 of 1
Delete