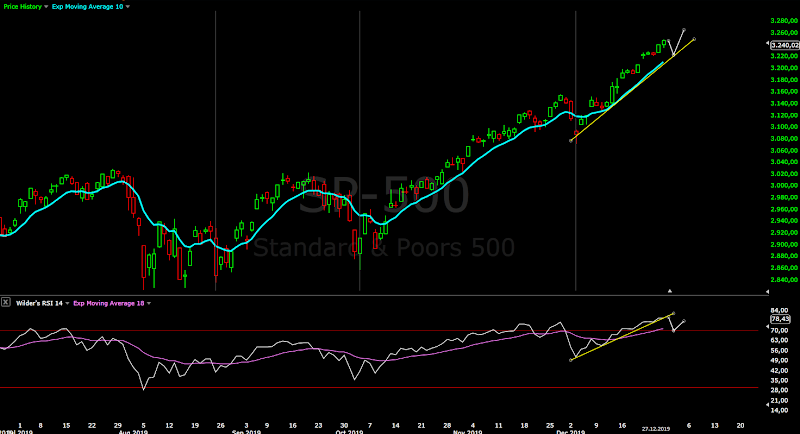
Maybe you do not remember, when we saw this two days decline early December I wrote it is strange it does not really fit like w4 from the October low.... but I just follow the herd. Now we have the next wave which is way too big to be w5 from the October low.... and if you accept that they are from different degree everything makes sense.
I think we have impulse for c/B which begun late August and not in October - changed the counts accordingly below.
TECHNICAL PICTURE and ELLIOTT WAVES
Short term - from October you have extended w3 2,618 so we should not have another extended wave. It is taking too long time and price so I think we have a wave from early December currently iii/5/c/B.
Of course any move lower should be corrective and stay in the channel and above support or the the wave from December is finished.
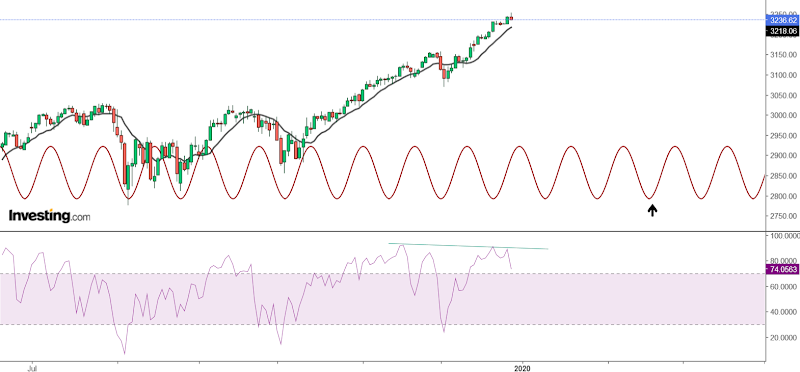
Intermediate term - small down and up will finish this fifth wave and give time for topping and short term divergences for the indicators and market breadth. Even MACD and RSI count like five waves from the August low:)
Long term - the top of wave B in 1-2 weeks, then expect sell off to begin and to continue into Q2.2020. It will complete the correction which begun in January 2018.
MARKET BREADTH INDICATORS
Market Breadth Indicators - market breadth has not been reset so that the trend can re-energize for another long lasting rally, market breadth is still showing long term divergence. Fear&greed with extreme again 93-94.
McClellan Oscillator - above zero, short term lower high.
McClellan Summation Index - buy signal, with divergence.
Weekly Stochastic of the Summation Index - buy signal.
Bullish Percentage - buy signal and divergence.
Percent of Stocks above MA50 - buy signal and divergences.
Fear Indicator VIX - higher low and divergence.
Advance-Decline Issues - lower high and divergence.
HURST CYCLES
Daily/trading cycle - it is up, the price is above MA10 and RSI above MA18 and above the respective trend lines.
Hurst cycles - three days sideways move for 14 day low(20 day Hurst cycle) and the next one is running, watching mid-February or early March for important low.
Week 12 for the 20 week cycle.... it takes too long for a 20w cycle from August.
Subscribe to:
Post Comments (Atom)


You say target for wave C 2250 but wave A was 600 points then 3200-600 = 2600, wave C can only arrive at that level 2500-2600 for A=C
ReplyDeleteRead about expanded flat.
Deletec=161 of a
Deletehttps://www.youtube.com/watch?v=s-X6fCHFzF0
ReplyDeleteYour opinion about this, 9 year cycle from 2013 to 2018
There is no such 9 year cycle low in 2018.
DeleteIf 2009 was a 9 year cycle low then maybe december 2018 too
DeleteI notice your short term charts expect a move lower at market open but usually moves higher, which has happened a few times recently, will this now alter the short term chart bringing the 5th wave to above 3300?
ReplyDeleteThis is not exactly at opening should be lower, it is more we should see something lower in the next days.
DeleteIt could easily open higher for b/4. It is too early to say if we will see 3300 or not.
Did you cover your initial short position?
DeleteOnce around FOMC and now I have another short position.... waiting to see if we have reversal or not. I am not sure if it worth to close it....
DeleteCool - looks like it hit the support area you highlighted and is making its way up from there now
ReplyDeleteLet's see if it will stay above the low for the day... another lower low and it will look like impulse.
Deletekrasi what is your uvxy price projection thanx?
ReplyDeleteIf we do not have reversal probably around 12,50...
DeleteSP 4000 for 2020, just kidding :) happy new year
ReplyDeleteEverything with the time, happy new year:)
DeleteThere is 5 waves doun in 4 hour
ReplyDeleteIt is possible... waiting for conformation - only three waves up.
DeleteHappy new year!!!
ReplyDeleteSergio, we missed you, come soon :-)
DeleteAny thoughts on the last few hours of price action last night, climbed 20 points higher at the end
ReplyDeleteeach week that passes is more likely a 40 week low cycle in October
ReplyDeleteI posted it above....
DeleteIt looks like the top is in.... only three waves higher will confirm it.
ReplyDelete