Trading cycle - sell signal. It looks bad, but the analysis is not confirming it so I am just watching.

TECHNICAL PICTURE and ELLIOTT WAVES
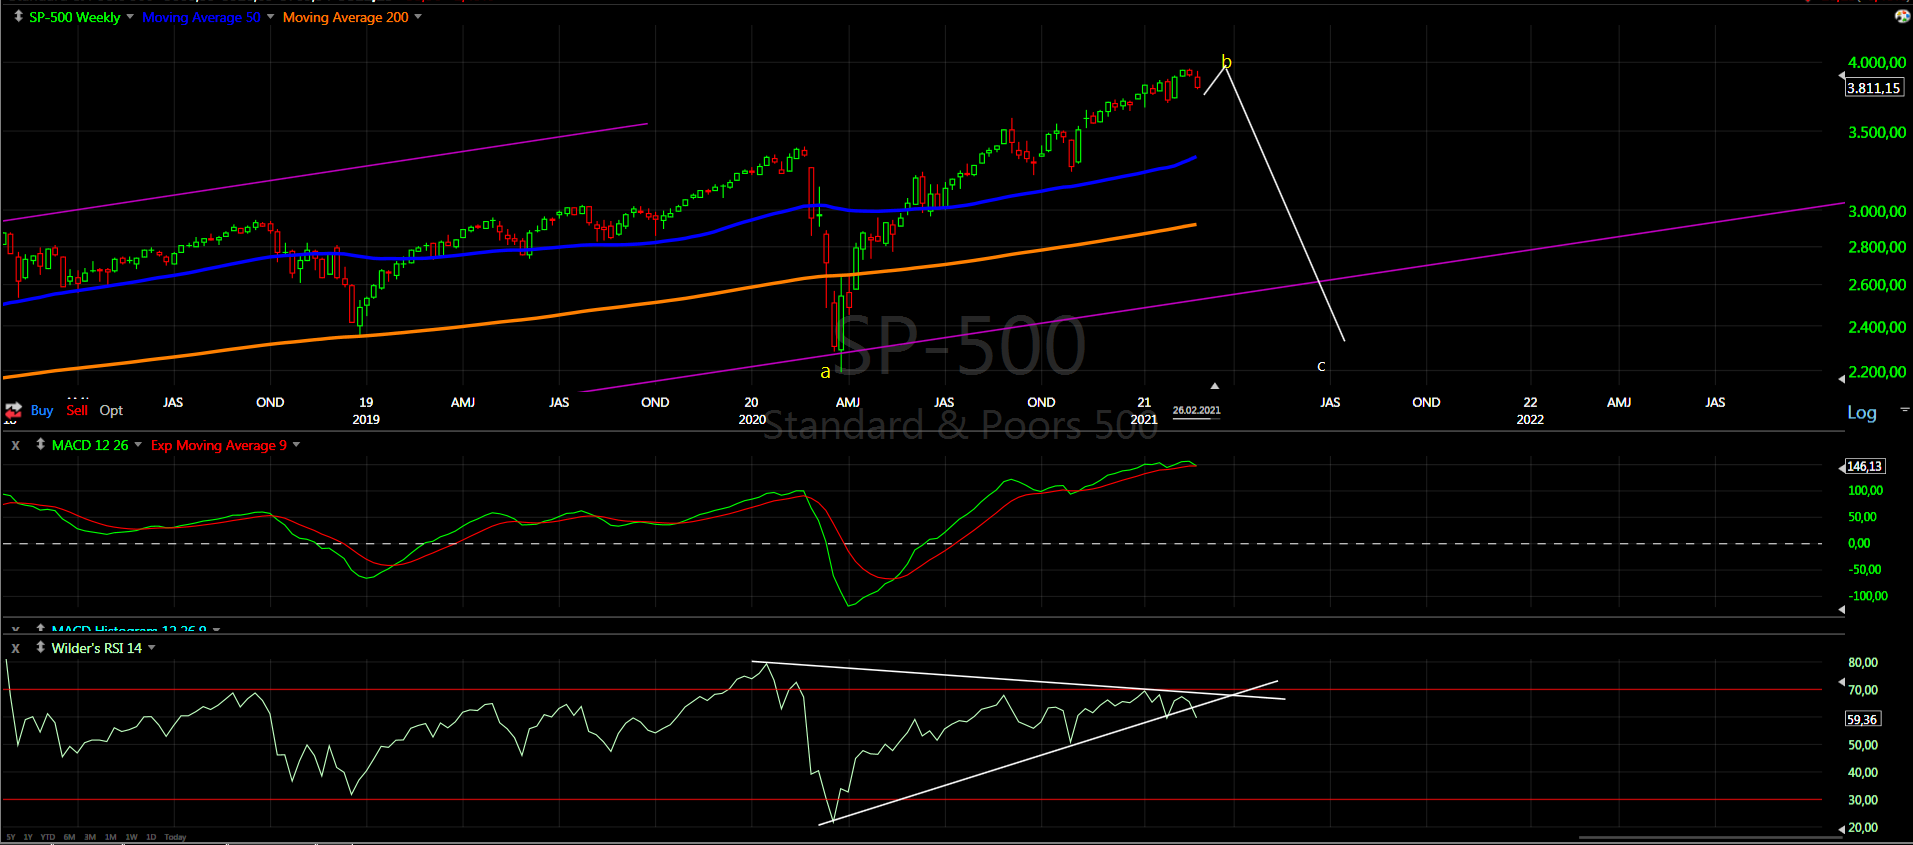
Short term - it looks like big zig-zag to me for the expected b/f-wave. It could start lower next week, but then it should reverse higher.

Intermediate term - I see one big zig-zag up. You can count it as W-X-Y(white) classic EW, but we do not have impulses. More likely series of zig-zags A-B-C(yellow) with the C-wave as a diametric.
The indicators with multiple divergences, waiting to see if MA50 will hold and confirm b/f-wave for one more push up.

Long term - the bull market completed in 2018. Since then a bunch of corrective waves. Currently I think this rally should be a corrective wave of a bigger pattern most likely triangle. Look at NDX we have corrective wave which is 1,618 bigger than the previous one which could be only b of a triangle. I think the best looking pattern is Neely's triangle.
MARKET BREADTH INDICATORS
Market Breadth Indicators - turned lower, which is not a surprise for a red week... so far there is no technical damages.
McClellan Oscillator - below zero.
McClellan Summation Index - sell signal.
Weekly Stochastic of the Summation Index - buy signal.
Bullish Percentage - pointing lower.
Percent of Stocks above MA50 - pointing lower.
Fear Indicator VIX - spike higher ... one more test of the low?
Advance-Decline Issues - still holding the trend line, no serious damages.
HURST CYCLES
Short term cycles - this week should be 5w low next is up for 5w high and we need one more 20d cycle higher to complete it.

Week 4 for the 20 week cycle. You can argue for the NDX... maybe SP500 that this is the 20 week low, but DJ and NYSE does not look like a low at all so I will stick to the count that we saw the 20 week low.
Again the highs - if we see two weeks up for 4x7weeks than time and final pattern for the second legs in 2019 and now will look the same:)


Hi Krasi what do you think about this counts for DAX? Monthly: https://subefotos.com/ver/?c1b51d31699845462ad06f60ecf91dc4o.jpg#codigos and weekly https://subefotos.com/ver/?6d15a9eb3a1218cb6af70077c6fe8c68o.jpg#codigos Thanks for your answer and sharing your work with us.
ReplyDeleteThe (5) is way too short in time compared to all other waves. It is not diagonal it is just a zig-zag.
DeleteIt should be just i/(5) if this is the right count. This is my alternate scenario if it is not expanding triangle.
In a few months we will know who will win the war of the waves:))
I didn`t think about i/(5) because we are near the (1)=(5) but it is a great alternative. Thank you very much!
Deletethe downside doesn't look complete - would prefer a bottom on monday/tuesday , but to annoy the most people , they could easily rally us back to 3870 this week before printing the low by mid March . Corrections in this phase have always been more complex than you can possibly imagine ...
ReplyDeleteIt is already complicated the legs lower are complex zig-zags so I do not believe that it will get much more complex.... unless the last wave is a triangle and this is b of it and we will see more up and down in a range.
DeleteBased in what people have commented, this analysis matches Neely analysis. David Hurst also posted an update and he has very similar analysis with 18mon low expected around middle of the year. I guess time to watch key levels to confirm reversal.
ReplyDeleteSo, in two weeks we are going to have the 40w?
ReplyDeleteSometimes next week we should see high of 18 month magnitude.
DeleteStraight back to 3870 , as seemed likely .
ReplyDeleteAnother decision point around here - rally back to retest the high or a new spike low .
This strong moves in both directions are hint that maybe we have a triangle like this - https://invst.ly/t-nt1
DeleteI doubt we will see a lower low, than it will look like diagonal, which means reversal.... I do not believe in this diagonal reversals.
On the other side it feels too big and too fast for the final zig-zag higher.
Krasi, Are you still thinking that this low is only 5w low instead of 20w low?.
ReplyDelete20w low could be the last week or even this one.
Yes, the cycle lows are where the pattern is completed. The low of higher degree is the previous one not the current low.
DeleteIt is explained above, just look at other indices.
I'm getting sea sick from these moves
ReplyDeleteAmazing we are going to top right when the cases are dropping. "The U.S. Is Edging Toward Normal, Alarming Some Officials" https://www.nytimes.com/live/2021/03/01/world/covid-19-coronavirus
ReplyDeleteCorona is old news.... the market does not care.
DeleteThis market doesn't seem to care about anything. :-) What about DXY? Does that matter?
DeleteLooking at the pattern at this point , the leading diagonal for 1 is higher odds and will fool the most people .
ReplyDeleteNQ will remain in a downtrend unless it can close above the 13400 area and with new lows then probable there , it's reasonable to assume es will follow . If NQ were to fall out of its downtrend then all bearish bets are off.
Until that happens , sell the lower highs .....
I do not believe that LD exist.
Deletekrasi time to buy gold and silver?
ReplyDeletePattern and cycles do not look complete. Probably higher for some kind of b-wave and one more leg lower for 18m cycle low. Then it should be a better buy.
DeleteWxyxz to 3700 I think then everyone shorts, and we go to 4k 😁
ReplyDeleteHow do you guys trade this thing? I got in on the 10 day on 2/24 then murdered the next day. Got in yesterday and got crapped on today.
ReplyDeleteWatch the guy on trading lounge on youtube, he's good for swing trading
ReplyDeleteWhat happens after the long term C down? We start over again with wave 1 or does that start wave 5?
ReplyDeleteMy primary scenario is Neely's expanding triangle. This means one more time up to 3800-4000 and one more time lower to around 1500.
DeleteI know it's a long time out but what happens after that with the cycles? After the C fall to around 1500 does it all start over again? Like wave 1 begins to wave 5 over many many years?
DeleteAccording Neely major wave 5 up should follow... 20-25 years or more
Deletethank u
Deletebonds , dollar , gold & es all look unfinished .
ReplyDeleteLooking for a b wave in es to start today then new lows next week and reversal in all assets for the final rally.
I can only agree... many are talking about diagonal and reversal, but it is corrective structure which needs one more up and down for even bigger double zigzag.
DeleteIf it's a final rally (I agree with this), would that take us into may then? Each wave up has been at least a few months.
DeleteNo, this two weeks up will start next week not this one... second half of March instead of mid Mach.
Delete3/4 swing low and Rally into 3/13-14
ReplyDeleteHohoho....
DeleteThanks Krasi - nice to be on the same page . Tech should lead up now and maybe we get a divergent low in mid to late March . The ultimate es and indu targets are some way below today's lows .
ReplyDeleteIsn't this move especially in NDX something bigger than what you expect?
ReplyDeleteIt is possible that NDX reversed already, but the rest is on track - DJ/NYSE/Europe.
DeleteThis feels like we are going straight to 18 month low. Indices looking so weak. What do you think Krasi?
ReplyDeleteI think this is not a reversal. It is taking too long.
DeleteThis is 20 week low
ReplyDeleteI do not agree.
DeleteI understand you don't have a crystal ball, but what is your forecast for how low this thing goes? It would be a shame if we missed out on the very crash we've been waiting for. Thank you
ReplyDeleteThe same analysis another week or two.
Deletejust like I said, the longer and deeper this pullback lasts the longer the next final rally
ReplyDeleteSo the 3740 area identified is acting as as support , spike below but not acceleration below .
ReplyDeleteIdeally now we need a b wave up and then a new low in 7-10 days time . the 13th or 16th maybe for the low .
See if today closes up for first confirmation .
I think the correction is done.
Deletedon't see that in the cash index .
DeleteSee where we close later . Above 3811 area & I might be more persuaded ....
I think yesterday may have been a 5 week low (if not next 1-2 days) followed by a bounce and a more important 20 week low early April to test the 50 week moving average currently at 3357 and rising (probably around 3400 by then). Big bounce into late April early May and a big decline into late June early July, maybe around 2800-3000spx. Overall the Bull is far from being dead. Early 2022 may be the time to look for the mother of all tops at much higher levels. We will see... Krasi comments always welcome.
ReplyDeleteJP
We have one leg up 5 months sideways correction and now the second leg running into the fifth month and should complete soon.
DeleteWhat you are describing is the alternate scenario ending diagonal - this is w1 after that w2 2700-2800 after that waves 3-4-5 into 2022 for 4y cycle high.
Thank you!
DeleteKrasi, could you show a chart for the B and C wave you expect next? Thank you
ReplyDeleteHi Krasi, if you get time, mind posting SPX and NDX forecast today before your weekend update?
ReplyDeleteOne more low is needed one possibility b triangle and c=a - https://invst.ly/u1sy8
DeleteLook at NYA, not a triangle. This is a triple zigzag correction or diagonal (leading or ending)
DeleteWho says NYA has the same pattern?
DeleteBetter a triangle than all the fantasy patterns which you counted.
Now that market has had fooled everyone, we going to rip next week and it could last until 3 more months like I was saying. Either you say this is wave 1 down and we started descent or this is a pullback as part of bigger correction. If it's a pullback then we can go up another 3 months no problem. If it's wave 1 down we will likely top at end of the month.
ReplyDeleteJust my opinion but your cycles have been wrong ever since march of last year. I don't know why we should take strongly that you think one more month until we top. Ask Slim has been pretty accurate and he is predicting a top out until May.
And Peter Eliades says imminent top - which cycle guru I am supposed to listen?
DeleteSoon you will understand why.
uber volatile - but still think 3811 on the close is important tonight and will give us a clue on whether to expect a further c down next week or a continued b wave rally or even a retest of the highs .
ReplyDeletefavouring one more low in March at the moment
doesn't think just look like an abc? C wave to get everyone excited for next week before death and destruction?
ReplyDeletethis - https://tvc-invdn-com.akamaized.net/data/tvc_1145bfcf439543013ca31551bdf2eb6c.png
DeleteI agree it is just a bounce into next week maybe up to 3870ish before we collapse into month end to the 50 week moving average of 3400ish. we'll see.
DeleteJP
Btw Krasi, it looks like you were spot on with your forecast for DXY! :-) Looks like it has reversed.
ReplyDeleteDo you think this is the top for oil? :-)
I would say several weeks to calm down and reverse.
Delete