With some delay the next long term update.
No big surprises - the USD with ugly pattern, but still the expected a-b-c and precious metals/miners with a low in Q2, but it does not look like important low rather just intermediate term low.
The current view for the next 6 months:
- Stocks - final wave lower for wave 4 from 2009 to begin, possible surprise flat b/B and one more high later this year.
- Bonds - another month or two higher and bonds should turn lower again.
- USD - one more leg higher to finish the move which begun early 2018.
- Precious metals/miners - high in July/August and final sell off for the 4 year cycle to begin.
- Crude Oil - like the stock indexes - wave C lower with possible surprise one more high for B.
- STOCKS
We saw multi month rally as expected. The big picture - we should see one more sell off to finish w4 from 2009 with 4 year cycle low in 2020. Possible surprise is flat for b/B and one more rally to around 3050 before the reversal lower.
- BONDS
I was expecting multi month move higher and it is playing out. Next we should 4 year cycle high in the next few months and decline.
10 year yield - I expect one more low to finish a-b-c and RSI divergence, then higher at least to the resistance zone.
- FOREX
The pattern is challenging:) Many see the USD plunging lower and PM to the moon, but I think the USD move up is not over.
The USD bears see diagonal and sharp plunge, I think it is wave 2 or B and the low should be tested late 2019/early 2020.
The pattern is a mess looking at RSI I see one wave lower and zig-zag higher that is why I do not bet on ED for wave C and reversal rather wave 2 or B.
Long term I expect big A-B-C pattern and important 16 year cycle high(USD low) 2025-2026, but at the moment I can not say how complex it will be.
The first option with complex wave B
Or simple zig-zag like this
JPY - from the late 2016 low it is a mess, for me this is some complex corrective crap(only zig-zags to the upside) and we have not seen the 4 year cycle low. You have sequence 4y low(green) -> 4y high(red) -> 4y low(green) and so on. What I want to say - you can not have two 4y cycle highs without 4y cycle low between them, you can not expect to see a strong rally for 4/8 year cycle high before we see the next 4 year cycle low....
I can not see simple B wave like EUR/USD, only the complex pattern seems to fit....
USD/JPY - mirror image... the pattern is more complex and it takes longer than expected, but it has not changed.
- GOLD/SILVER/MINERS
We saw declines into May as expected, gold/GDX strong and silver/GDXJ close to the lows from 2017... but this is not 4 year cycle low. It looks like much bigger corrective pattern which begun August-September last year and I expect to see one more sell off for 4 year cycle low. Many including the most "experts" with paid subscription jumping on the break out train, but if the low is in it was in 2017 with 4 year cycle lasting 2.9 years... I do not think so. Only gold is stronger and could make higher low.
GOLD the strongest from the PM sector with shallow decline from February to May. The consensus is for a break out higher.... I can not see important low. The same thoughts about cycles like JPY above before a rally we need to see 4 year cycle low. The possible pattern is some kind of flat - running or expanded. When the pattern is finished we should see strong rally in 2020 for 8 year cycle high

Silver much weaker - one or two months to finish the current move up, then we should see one more sell off.... the third 18m cycle and the 4 year cycle do not look complete.
Miners - similar idea I want to see 4 year cycle before a strong rally to 4/8 year cycle high. The two EW patterns are the same like for the EUR\USD shown above - something complex or huge C. The rally next year should give us a clue what exactly is going on.
- CRUDE OIL/NATGAS
Multi month corrective wave higher as expected. The pattern is tricky hanging in the middle at the moment... there is more to the downside, but one final higher high for b is possible. The big picture the same question like EUR/USD and PM sector something more complex or straight up for C.... we can only wait and see how it develops in 2020.
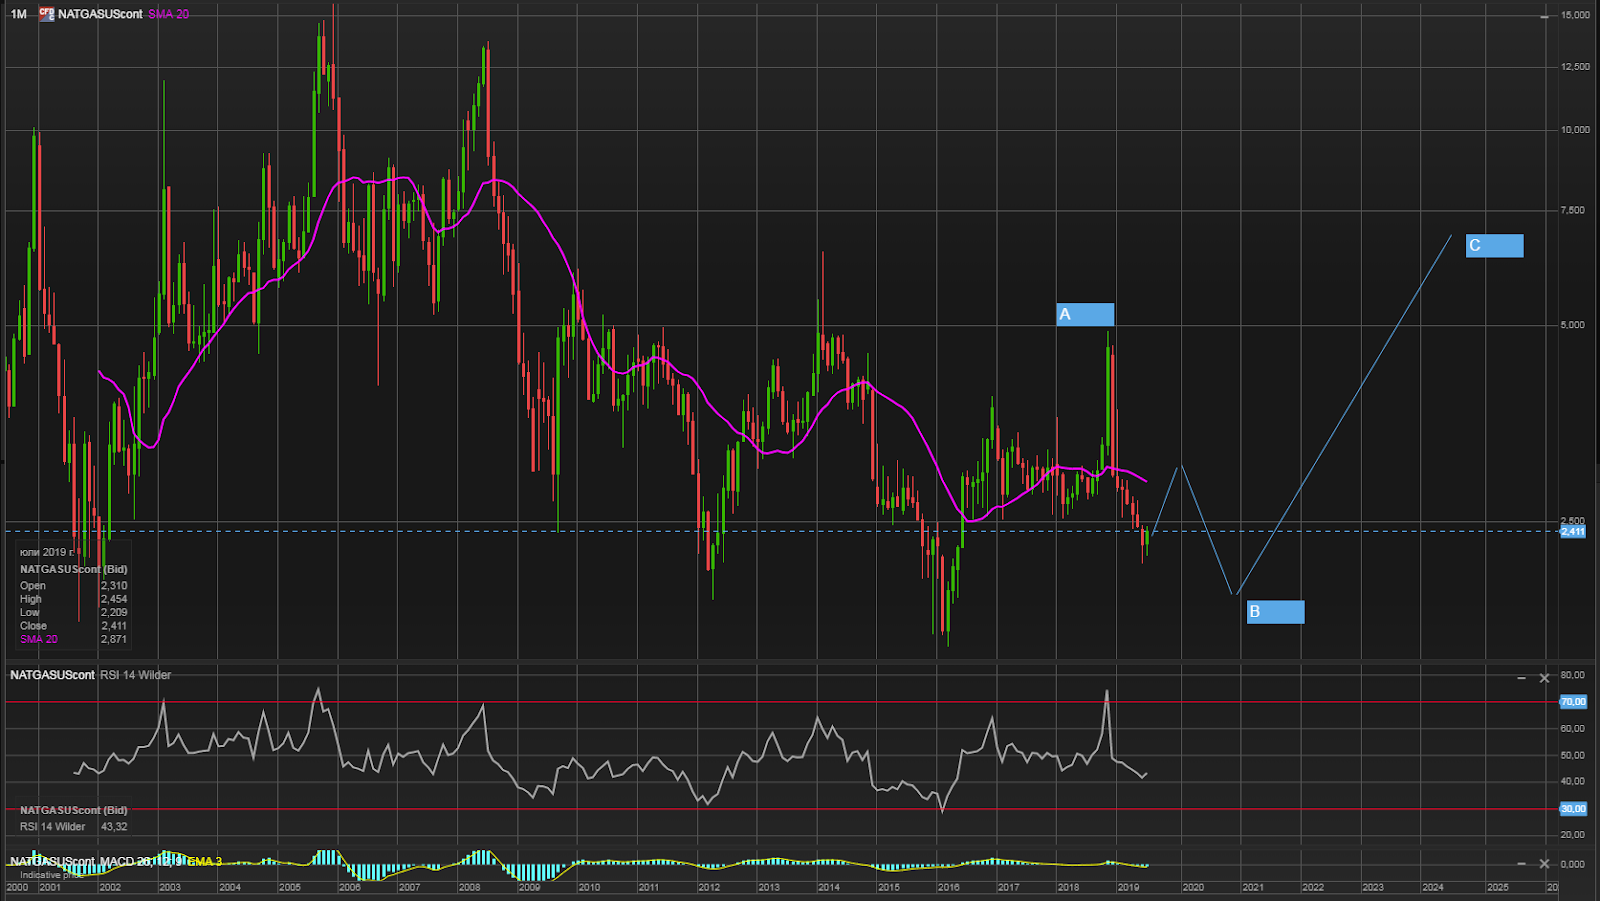
Natgas - I was expecting more to the downside to complete the move lower and this is what happened. In the next months we should see bigger and longer retracement higher at least to MA200 daily/MA50 weekly around 3-3.10
Similar to crude oil for Natgas seems that Benner cycle sequence 11-10-7 works better than Hurst cycles. History is too short, but it seems to work good - HIGHS - 90(7)97(11)2008(10)2018(7)2025 / LOWS - 92(10)2002(7)2009(11)2020(10)2030.
Next important low is in 2020 and the next high is in 2025 which fits with the EW pattern and the rest of the commodity complex.