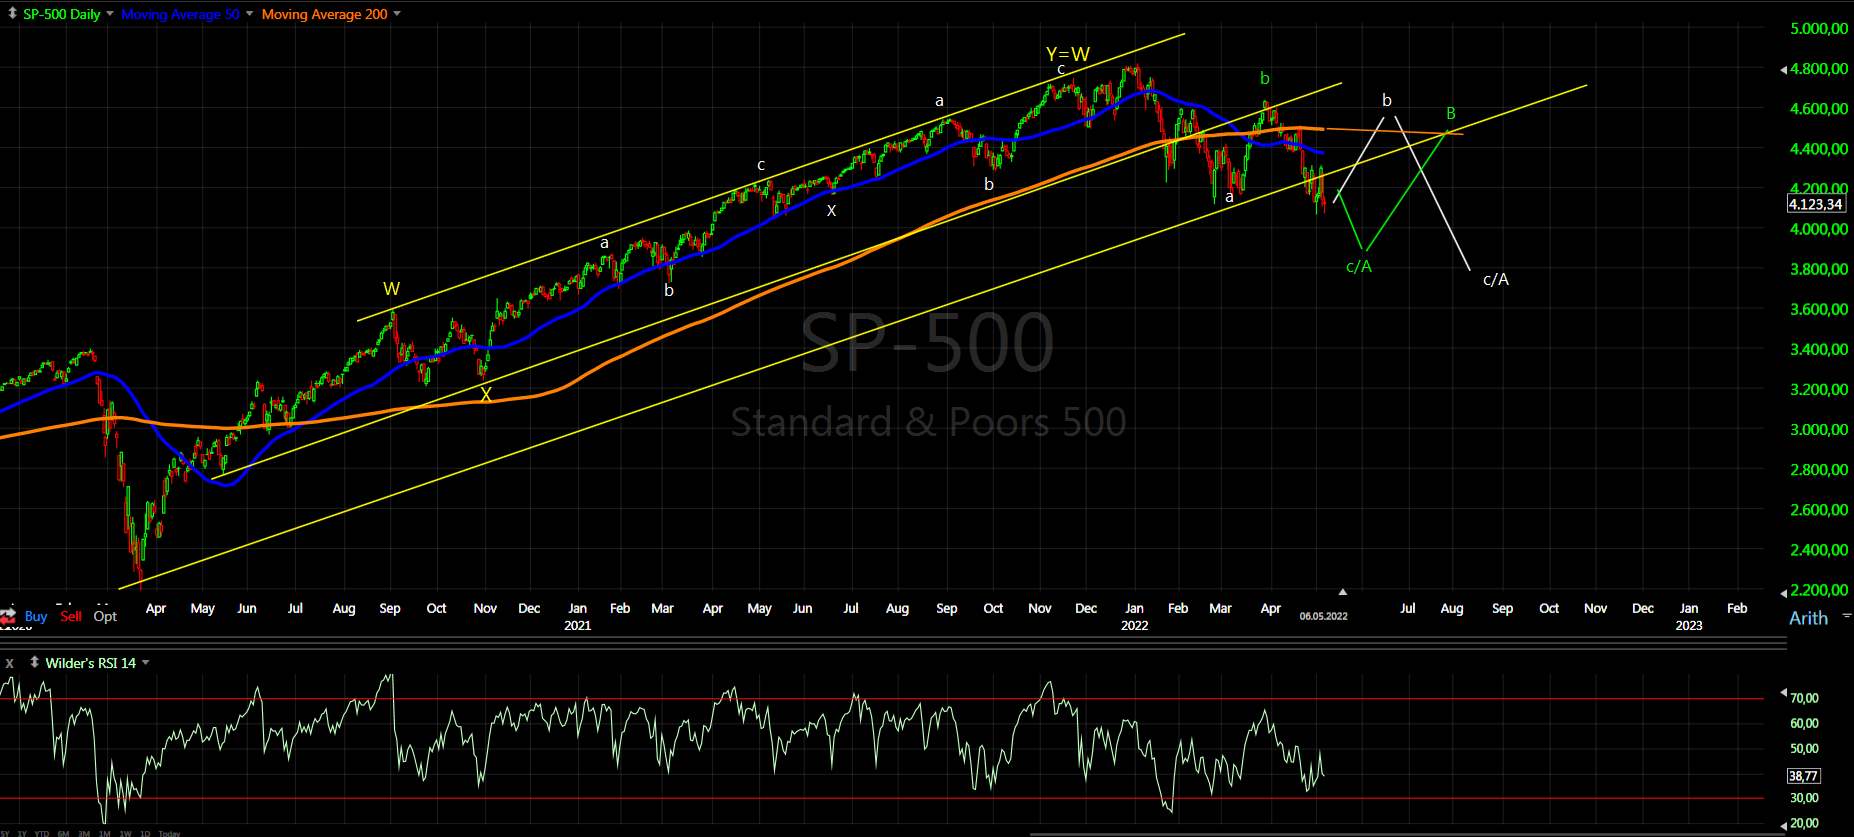
Short term looking the pattern I think we should see bounce and one more low to complete the decline from the high in late March.
Intermediate term we have 6 weeks decline this means to expect bearish 10w high so some kind of bounce and lower low. Long term even if you count from the January high we have 5 months lower this means to expect bearish 40w high with lower high in summer and continuation lower.
Market breadth - many in oversold territory and this happens in bear markets. The confirmation is if we see bounce and another low with divergence.
To sum up - the signs are pointing to a bounce and lower low to complete the decline then higher in summer with lower high and continuation lower in autumn.
TRADING
Trading trigger - sell signal, very weak cycle high is expected.
Analysis - long term sell the rips, we have major top. Nearing to intermediate term low.
P.S. - for a trade both analysis and trigger should point in the same direction.
TECHNICAL PICTURE and ELLIOTT WAVES
Short term - from the last high we have 5 legs lower, but it does not look like an impulse at all so it should be another double zig-zag.
Intermediate term - I see W-x-Y with complex double zig-zag for Y=W.
The trendline is broken now waiting for a low in the next few weeks and some kind of MA200/trend line test in summer.
Long term - We saw the high, if we are lucky this is b-wave, if not huge double zig-zag from the 2009 low was completed and it will get very ugly in the next years.
MARKET BREADTH INDICATORS
Market Breadth Indicators - many hit oversold levels, which usually happens in bear markets, and now we have bounce higher.
McClellan Oscillator - bounce from slightly oversold level.
McClellan Summation Index - sell signal, very oversold.
Weekly Stochastic of the Summation Index - sell signal.
Bullish Percentage - oversold level reached.
Percent of Stocks above MA50 - oversold level reached.
Fear Indicator VIX - around the previous high.
Advance-Decline Issues - oversold level hit, but still higher low.
HURST CYCLES
Short term cycles - we have 20d low and next week we should see 20d high. The longer cycles - there is room for interpretation where to pinpoint them.
Week 15 for the 20w cycle. Changed the chart to fit the pattern.
Long term we have 4 year cycle high and transition from up to down. The 18m low either late September with one extra 20w cycle or alternate on time in June/July... waiting to see how the pattern will play out to confirm one of the two options.
What we are seeing makes sense if the 18m low was in late September and now heading into 40w low. The European indices have very clear low in March most likely 40w low, which means the 18m low was in the summer of 2021.
Very confusing the pattern can diverge between the indices, but I have not seen the cycles to diverge.
May 14, 2022
May 7, 2022
Weekly preview
Very volatile price action around FOMC - it was expected. The indices are still trying to find a bottom... maybe we saw it is difficult to say. Overall the indices are close or hit 10w low and next we should see 10w cycle high, which looks very weak at the moment.
TRADING
Trading trigger - sell signal, very weak cycle high is expected 2/3 of the time 27 days it is moving lower.
Analysis - long term sell the rips, I think we have major top. Close to intermediate term low.
P.S. - for a trade both analysis and trigger should point in the same direction.
TECHNICAL PICTURE and ELLIOTT WAVES
Short term - not clear what exactly is going on. Very deep retracement so the possible patterns are flat and triangle... or the decline is not over.
Intermediate term - I see W-x-Y with complex double zig-zag for Y=W. SP500 trying to find bottom, after that we should see the completition of some kind of b-wave - either in the b-wave(white) already or it will start soon(green).
Long term - We saw the high, if we are lucky this is b-wave, if not huge double zig-zag from 2009 was completed and it will get very ugly.
MARKET BREADTH INDICATORS
Market Breadth Indicators - look like nearing a bottom, the sell off looks exhausted.
McClellan Oscillator - turned below zero, expecting to see divergence.
McClellan Summation Index - sell signal.
Weekly Stochastic of the Summation Index - sell signal.
Bullish Percentage - in the middle of the range.
Percent of Stocks above MA50 - turned lower higher low so far.
Fear Indicator VIX - lower high.
Advance-Decline Issues - higher low.
HURST CYCLES
Short term cycles - expecting to see 10w low soon or we saw it already.
Week 8 for the 20w cycle.
Long term we have 4 year cycle high and transition from up to down. The 18m low either late September with one extra 20w cycle or alternate on time in June/July... waiting to see how the pattern will play out to confirm one of the two options.
If the 18m low was in late September the indices should be close to 40w low. The European indices have very clear low most likely 40w low, which means the 18m low was in the summer of 2021.
Trading trigger - sell signal, very weak cycle high is expected 2/3 of the time 27 days it is moving lower.
Analysis - long term sell the rips, I think we have major top. Close to intermediate term low.
P.S. - for a trade both analysis and trigger should point in the same direction.
TECHNICAL PICTURE and ELLIOTT WAVES
Short term - not clear what exactly is going on. Very deep retracement so the possible patterns are flat and triangle... or the decline is not over.
Intermediate term - I see W-x-Y with complex double zig-zag for Y=W. SP500 trying to find bottom, after that we should see the completition of some kind of b-wave - either in the b-wave(white) already or it will start soon(green).
Long term - We saw the high, if we are lucky this is b-wave, if not huge double zig-zag from 2009 was completed and it will get very ugly.
MARKET BREADTH INDICATORS
Market Breadth Indicators - look like nearing a bottom, the sell off looks exhausted.
McClellan Oscillator - turned below zero, expecting to see divergence.
McClellan Summation Index - sell signal.
Weekly Stochastic of the Summation Index - sell signal.
Bullish Percentage - in the middle of the range.
Percent of Stocks above MA50 - turned lower higher low so far.
Fear Indicator VIX - lower high.
Advance-Decline Issues - higher low.
HURST CYCLES
Short term cycles - expecting to see 10w low soon or we saw it already.
Week 8 for the 20w cycle.
Long term we have 4 year cycle high and transition from up to down. The 18m low either late September with one extra 20w cycle or alternate on time in June/July... waiting to see how the pattern will play out to confirm one of the two options.
If the 18m low was in late September the indices should be close to 40w low. The European indices have very clear low most likely 40w low, which means the 18m low was in the summer of 2021.
Subscribe to:
Posts (Atom)