Feb 10, 2024

Weekly preview

The indices reached the end of the road. This is the top of corrective zig-zag B-wave and 18m high - next C-wave lower into 18m low. I do not buy the ED scenario, everybody very bullish expecting great 2024 - I see it completely different.


TRADING
Trading trigger - buy signal.
Analysis - at the top. Important turn lower next week.
P.S. - for a trade both analysis and trigger should point in the same direction.

TECHNICAL PICTURE and ELLIOTT WAVES
Short term - NDX double zig-zag with three different Fibo measurements coverging together.


Intermediate term - two zig-zags down and up... waiting for B-wave to be completed and C-wave for a flat should follow.


Long term - 4y cycle high the end of 2021, now a-b with c-wave lower in 2024.


MARKET BREADTH INDICATORS
Market Breadth Indicators - very weak with divergences.
McClellan Oscillator - around zero with divergence.
McClellan Summation Index - sell signal.
Weekly Stochastic of the Summation Index - sell signal.
Bullish Percentage - declining, below 70.
Percent of Stocks above MA50 - declining, below 75.
Advance-Decline Issues - in the middle of the range with divergence.
Fear Indicator VIX - higher lows.


HURST CYCLES
Short term cycles - at 20d high which should be 5w/40w high.


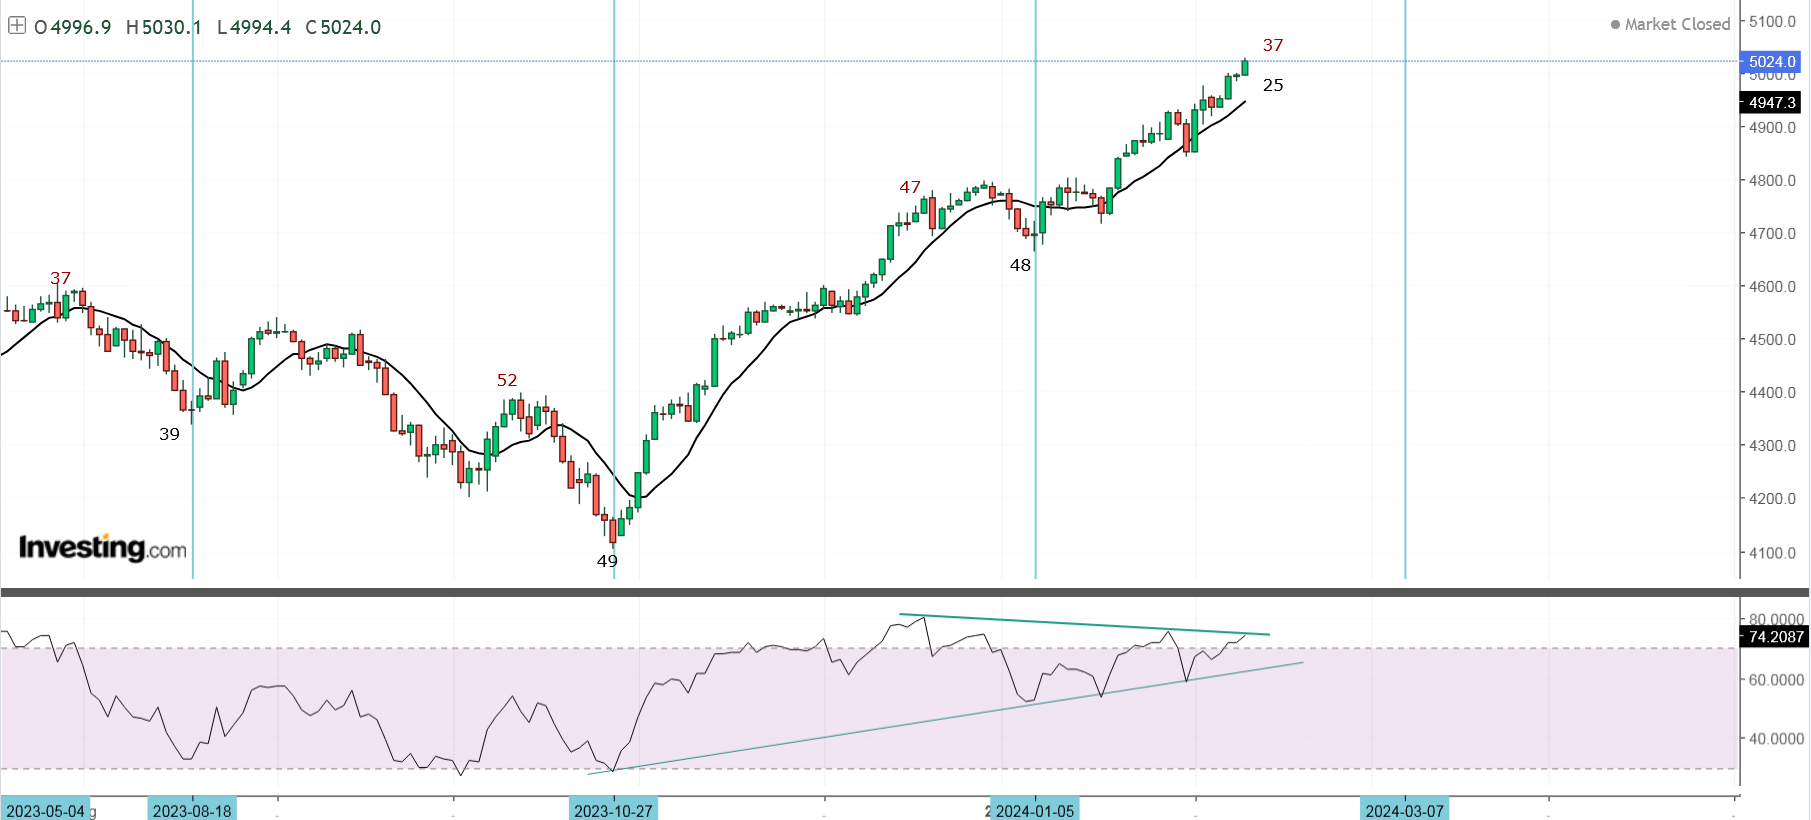
We have 26 months from the previous high which means we have two 18m highs which means this is 18m high which means next is decline into 18m low. The highs and lows are aligned at pattern highs and lows, the sequence moves nicely - so this is the most likely count.
Anything else is make it fit... I will go this path twisting it to fit the theory only if this is proven wrong and it is not.
P.S. This is NDX with 2x13 months the same for the DAX is 2x15 months... I do not see how this is wrong.

Feb 3, 2024

Weekly preview

Lower into FOMC and higher as expected and now everything fits together. We have the pattern following the analysis and completed, cycles completing nicely 10w high after 10w low and 8x5w cycle highs, market breadth weak and divergences, indicators with divergences, NYSE managed to reach 90% retracement for a flat pattern too.
We can see one more pop up on Monday but, this is important top, it can get realy ugly... many see possible ED, election year, years ending with 4 and January higher are always higher:) it is impossible to decline. Looking at the last chart I am not an optimist and that is why I have the top in 2021/2022.


TRADING
Trading trigger - buy signal.
Analysis - at the top. Important turn lower next week.
P.S. - for a trade both analysis and trigger should point in the same direction.


TECHNICAL PICTURE and ELLIOTT WAVES
Short term - we saw the decline probably wave iv. The first target was reached it still possible to see one more high and touch the second target - starting from the lowest point this could be (iv) wave after extended (iii) wave


Intermediate term - two zig-zags down and up with the same size... waiting for B-wave to be completed and C-wave for a flat should follow.
Alternate wave 4 of ED expected.


Long term - 4y cycle high the end of 2021, now a-b-c lower into 4y cycle low in Q1 2024.
Very long term - most likely huge double zig-zag from the 2009 low was completed. Alternate if we are lucky this is some topping pattern triangle or ED and there is one more high in 2025.


MARKET BREADTH INDICATORS
Market Breadth Indicators - does not react to this rally at all... some pointing lower and divergences.
McClellan Oscillator - below zero.
McClellan Summation Index - sell signal.
Weekly Stochastic of the Summation Index - sell signal.
Bullish Percentage - moving lower.
Percent of Stocks above MA50 - moving lower.
Advance-Decline Issues - turned lower with divergence.
Fear Indicator VIX - series of higher lows.


HURST CYCLES
Short term cycles - 20d low as expected now at 20d high. It will complete 8x5w cycles for 40w cycle high.


Week 14 for 40w cycle. I expect 40w cycle low around June consisting of three extended 10w cycles.
Week 27, at a high of at least 40w magnitude... and very likely 18m high too.


Bonus chart(MSFT) for those still living in some fantasy world. We are at MAJOR inflection point. What started in the 80's is completing and reversing. Bonds/yields reversed after almost 40 years, the indices most likely in 2021/2022 too with a double top now caused by the tech sector completing their patterns. It is over, it is new environment, it is the inflection point of a life time. You can take profits or watch how everything evaporates.
It is not just MSFT but it is the perfect example - nothing much to explain the chart is clear. The trend from the last 30-40 years is over(it is much longer but the "investing life" is 30-40 years anyway).