Sep 30, 2013
Signals
Short term signal: DOWN - it will turn up above 1687
Intermediate term signal: DOWN - it will turn up above 1687
Comment: Push lower as expected. I think short term bottom is around the corner...
Watch price behavior for clues:
- top is in and leg down has begun - sell off continues and we see technical damages - move bellow 1670.
- a rally higher underway - not more than a pullback to support 1675-1682 and another move higher.
Levels to watch SP500:
- 1710 - resistance
- 1675-1682 - support level
- 1627 - support level
- 1598 - is major support.

Sep 28, 2013
Weekly review
Short term view - final push lower and relief rally with lower high...
Intermediate term view - lower high and intermediate term high is behind us...
Cool off as expected, the indexes are crawling down. A little bit confusing signs - DJIA very weak, Russel 2000 strong, SP500 something in the middle. Weekly chart with shooting star and red week which closed near at the lows, but on the daily chart no serious technical damages. A lot of divergences on the market breadth indicators. On the hourly chart the move looks like a wedge with expected break out on the upside, the short term cycle is bottoming...
Lets sum it up - the bigger time frames say something bad could happen but no confirmation for now, the shorter time frames say up,up...
My interpretation - the bigger time frame almost always win, which means rally ok but short term and then another move lower. How high? - DJIA is the weakest index lower high, SP500... I do not think it will make it to new highs.
TECHNICAL PICTURE
Short term - one final push lower around 1680 is 50% retracement and attempt for a rally. Bearish surprise will be if the price plunges bellow the lower wedge trend line than the target is ~1670 and 61,8% retracement.
 - Triple cross(EMA10 and EMA20 crossing EMA50) - triple cross is negative and short term trend is down.
Intermediate term - move lower to MA50, the price should find should find support short term around this levels. The scenarios stay the same like last week. We have double divergence on MACD. The bulls must consolidate the price and push higher to negate the divergence or a bigger correction will follow.
 - Trend direction EMA50/MACD - the price is above MA50 and MACD above zero the intermediate term trend is up. Watch out for the MACD double divergence.
- Momentum Histogram/RSI - momentum is pointing lower, short term trend is down.
Long term - I have looked closer the histogram and it seems that it makes the same pattern as the previous tops. Based on the histogram behavior move 4 of the sequence is behind us and the last final and strongest move has started. Lets see if the pattern continue to predict the price action.
 - Trend direction EMA50/MACD - long term trend is up - the price above MA50 and MACD above zero.
- Momentum Histogram/RSI - not clear.... no useful information
MARKET BREADTH INDICATORS
The Market Breadth Indicators - the signals are still bullish, oscillators are reseting and double divergences everywhere.
McClellan Oscillator - reseting after extremes as expected
McClellan Summation Index - buy signal, but weak and way bellow previous tops... making a double divergence.
Weekly Stochastic of the Summation Index - buy signal.
Bullish Percentage - buy signal, but no "enthusiasm" at all... double divergence.
Percent of Stocks above MA50 - every rally is followed by a lower high of the indicator.
Fear Indicator VXO - higher low and divergence... bad for stocks.
Percent of Stocks above MA200 - lower high after lower high.... the internals are worsening after every rally.
Issues Declining - higher low after higher low... less stocks are moving higher, more stock are moving lower.
HURST CYCLES
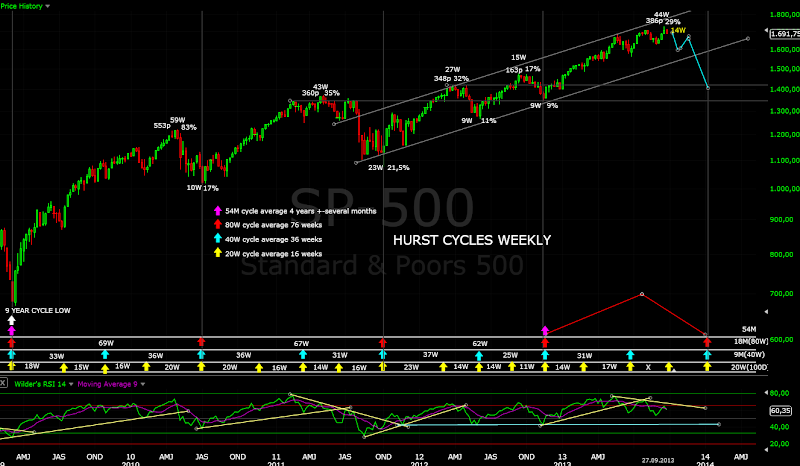
Lets take a look at our colorful cycle chart:) - first we have 3% standard pullback after only 15 days which means the move to the upside was 10 days shorter than usual and its size is 6,4% which is less than 7% or more compared with the previous moves. Ok the last rally was shorter and with smaller size than usual which means the bigger cycles are pulling the price lower. On the other side we are at day 22 of this 40 cycle and probably we will see a short term bottom. The bulls must master strong rally to negate the signs... I am skeptical, but w will see what happens next week.

If my interpretation of the cycles is right, we should see stronger move lower in the next 2-3 weeks to finish the current 20 week cycle.
Tom Demark SEQUENTIAL AND COUNTDOWN - this technique spots areas of exhaustion.
We saw a price flip on Monday and we have currently 5 of a setup. It is difficult to say if it will finish or we will see another price flip next week.
 No price flip for now... I think we will see something similar like in the circled area - green week followed by a price flip and correction.

Intermediate term view - lower high and intermediate term high is behind us...
Cool off as expected, the indexes are crawling down. A little bit confusing signs - DJIA very weak, Russel 2000 strong, SP500 something in the middle. Weekly chart with shooting star and red week which closed near at the lows, but on the daily chart no serious technical damages. A lot of divergences on the market breadth indicators. On the hourly chart the move looks like a wedge with expected break out on the upside, the short term cycle is bottoming...
Lets sum it up - the bigger time frames say something bad could happen but no confirmation for now, the shorter time frames say up,up...
My interpretation - the bigger time frame almost always win, which means rally ok but short term and then another move lower. How high? - DJIA is the weakest index lower high, SP500... I do not think it will make it to new highs.
TECHNICAL PICTURE
Short term - one final push lower around 1680 is 50% retracement and attempt for a rally. Bearish surprise will be if the price plunges bellow the lower wedge trend line than the target is ~1670 and 61,8% retracement.

Intermediate term - move lower to MA50, the price should find should find support short term around this levels. The scenarios stay the same like last week. We have double divergence on MACD. The bulls must consolidate the price and push higher to negate the divergence or a bigger correction will follow.

- Momentum Histogram/RSI - momentum is pointing lower, short term trend is down.
Long term - I have looked closer the histogram and it seems that it makes the same pattern as the previous tops. Based on the histogram behavior move 4 of the sequence is behind us and the last final and strongest move has started. Lets see if the pattern continue to predict the price action.

- Momentum Histogram/RSI - not clear.... no useful information
MARKET BREADTH INDICATORS
The Market Breadth Indicators - the signals are still bullish, oscillators are reseting and double divergences everywhere.
McClellan Oscillator - reseting after extremes as expected
McClellan Summation Index - buy signal, but weak and way bellow previous tops... making a double divergence.
Weekly Stochastic of the Summation Index - buy signal.
Bullish Percentage - buy signal, but no "enthusiasm" at all... double divergence.
Percent of Stocks above MA50 - every rally is followed by a lower high of the indicator.
Fear Indicator VXO - higher low and divergence... bad for stocks.
Percent of Stocks above MA200 - lower high after lower high.... the internals are worsening after every rally.
Issues Declining - higher low after higher low... less stocks are moving higher, more stock are moving lower.
HURST CYCLES
Lets take a look at our colorful cycle chart:) - first we have 3% standard pullback after only 15 days which means the move to the upside was 10 days shorter than usual and its size is 6,4% which is less than 7% or more compared with the previous moves. Ok the last rally was shorter and with smaller size than usual which means the bigger cycles are pulling the price lower. On the other side we are at day 22 of this 40 cycle and probably we will see a short term bottom. The bulls must master strong rally to negate the signs... I am skeptical, but w will see what happens next week.

If my interpretation of the cycles is right, we should see stronger move lower in the next 2-3 weeks to finish the current 20 week cycle.

Tom Demark SEQUENTIAL AND COUNTDOWN - this technique spots areas of exhaustion.
We saw a price flip on Monday and we have currently 5 of a setup. It is difficult to say if it will finish or we will see another price flip next week.


Subscribe to:
Posts (Atom)
